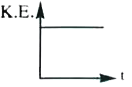
A
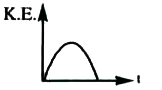
B
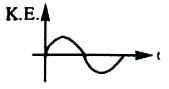
C
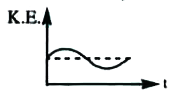
D
Text Solution
Verified by Experts
The correct Answer is:


Similar Questions
Explore conceptually related problems
Recommended Questions
- Which of the diagrams shown in figure most closely shows the variation...
Text Solution
|
- Figure shows a planet in an elliptical orbit around the Sun S . Where ...
Text Solution
|
- Which of the diagrams shown in figure. Most closely shows the variatio...
Text Solution
|
- Figure showns a planet in an elliptical orbit around the sun S. Where ...
Text Solution
|
- धरती सूर्य के चारों ओर दीर्घवृत्तीय (elliptical) कक्षा में चलती हैं । ...
Text Solution
|
- When the earth revolves round the sun in an elliptical orbit, its kine...
Text Solution
|
- Which of the diagrams shown below most closely shows the variation in ...
Text Solution
|
- The planet mercury is revolving in an Elliptical orbit around the sun ...
Text Solution
|
- Which of the diagrams shown below most closely shows the variation in ...
Text Solution
|