Text Solution
Verified by Experts


Topper's Solved these Questions
Similar Questions
Explore conceptually related problems
AAKASH SERIES-WAVES OPTICS-EXERCISE -III (POLARISITION)
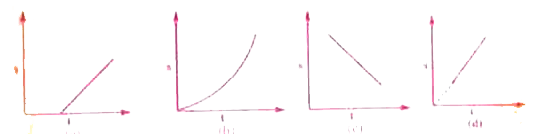
- The graph between the shifts of the interferring pattern in a double s...
Text Solution
|
- A ray of light is incident on the surface of a glass plate of r...
Text Solution
|
- A beam of unpolarised light is incident on a tourmaline crystal C(1). ...
Text Solution
|
- Two polaroids are kept crossed to each other . If one of them is rotat...
Text Solution
|
- Two nicol prisms are inclined to each other at an angle 30^(@). If I i...
Text Solution
|
- Two polarising plates have polarising directions parallel score to tra...
Text Solution
|
- Two polaroids are kept crossed to each other. Now one of them is rotat...
Text Solution
|
- Unpolarized light of intensity I(0) is incident on surface of a block ...
Text Solution
|
- In Young.s double slit experiment the separation d between the slits i...
Text Solution
|
- An stronmical refracting telescope will have large angular magnificati...
Text Solution
|
- Unpolarised light is incident from air on a plane surface of a materia...
Text Solution
|