Text Solution
Verified by Experts
The correct Answer is:


Similar Questions
Explore conceptually related problems
Recommended Questions
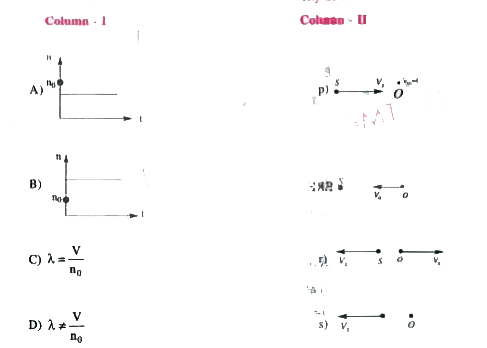
- The following figures in the Column-II indicate the direction of motio...
Text Solution
|
- Assertion : A sound source is approaching towards a stationary observe...
Text Solution
|
- A source of sound S is moving with a velocity of 50m//s towards a stat...
Text Solution
|
- The source producing sound and an observer both are moving along the d...
Text Solution
|
- A source of sound emitting a note of frequency 200 Hz moves towards an...
Text Solution
|
- A sound source has frequency f. Source and observer both have same spe...
Text Solution
|
- An observer is approaching a stationary source with a velocity 1/4 th ...
Text Solution
|
- An observer moving towards a stationary source observes that the appar...
Text Solution
|
- A source emits a frequency of "290Hz" .An observer is moving away from...
Text Solution
|