A
B
C
D
Text Solution
Verified by Experts
The correct Answer is:


Similar Questions
Explore conceptually related problems
Recommended Questions
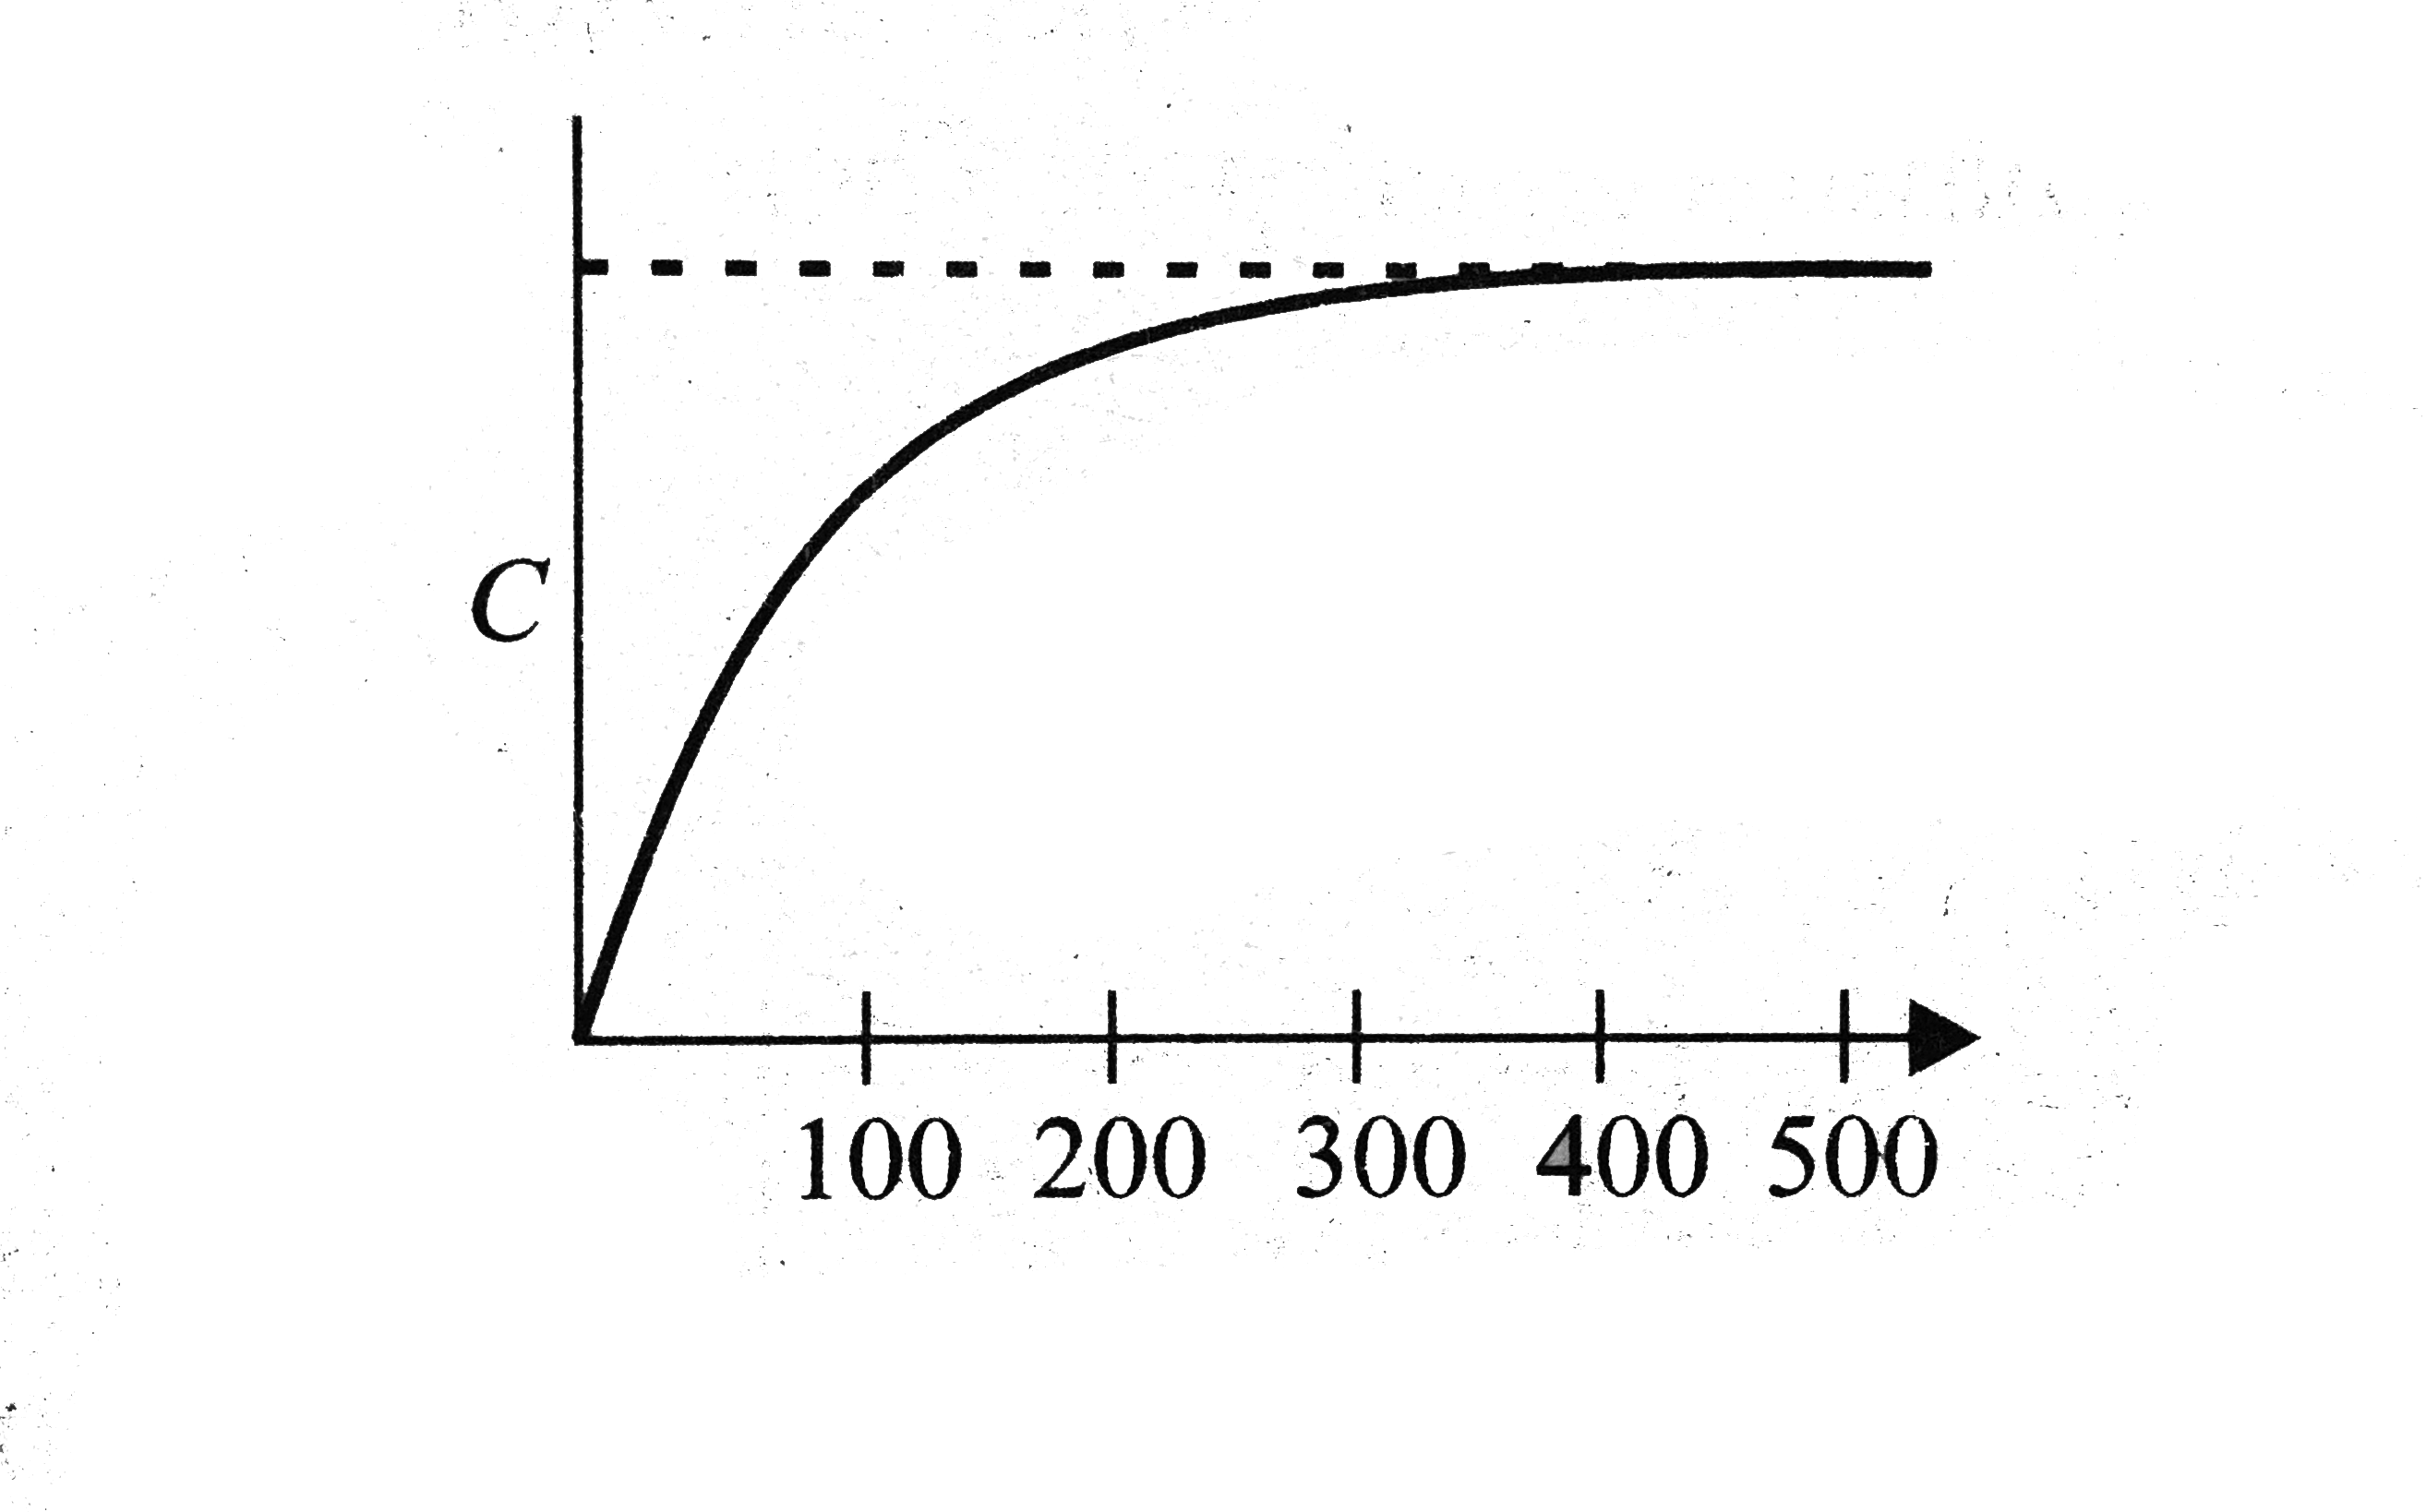
- The figure shows the variation of specific heat capacity (C) of a soli...
Text Solution
|
- The figure below shows the variation of specific heat capacity (C) of ...
Text Solution
|
- If specific ehat capacity of a substance in solid and liquid state is ...
Text Solution
|
- The specific heat of solids at low temperatures varies with absolute t...
Text Solution
|
- Assertion : A solid is floating in a liquid . If temperature is increa...
Text Solution
|
- A substance is in the solid from at 0^(@)C . The amount of heat added ...
Text Solution
|
- The ratio of specific heat capacity at constant pressure to the specif...
Text Solution
|
- चित्र में किसी ठोस की विशिष्ट उष्माधारिता (C ) का तापमान (T) पर निर्भर...
Text Solution
|
- For a body of mass m and specific heat capacity s, how much heat is re...
Text Solution
|