A
B
C
D
Text Solution
Verified by Experts
The correct Answer is:


Similar Questions
Explore conceptually related problems
Recommended Questions
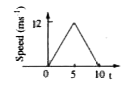
- The speed-time graph of a particle moving along a fixed direction is s...
Text Solution
|
- The x-t graph of a particle moving along a straight line is shown in f...
Text Solution
|
- What is wrong with the speed time graph as shown in Fig.2 (b) .25.
Text Solution
|
- The speed-time graph of a particle moving along a fixed direction is s...
Text Solution
|
- The x-t graph of particle moving along a straight line is shown in fi...
Text Solution
|
- Position-time graph for a particle moving along x- direction is as sho...
Text Solution
|
- The velocity-time graph for a particle moving along X-axis is shown in...
Text Solution
|
- The speed-time graph of a particle moving along a fixed direction as s...
Text Solution
|
- The velocity-time graph of a particle moving along a straight line is ...
Text Solution
|