Text Solution
Verified by Experts


Similar Questions
Explore conceptually related problems
Recommended Questions
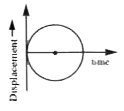
- Figure given here shows the displacement time graph for a particle. Is...
Text Solution
|
- Figure shows the displacement time graph of a particle moving on the X...
Text Solution
|
- The figure shows the displacement-time graph of a particle executing S...
Text Solution
|
- समझाइए कि क्या चित्र में प्रदर्शित ग्राफ व्यवहार में किसी कण की गति को...
Text Solution
|
- The figure shows a velocity-time graph of a particle moving along a st...
Text Solution
|
- The figure shows a velocity-time graph of a particle moving along a st...
Text Solution
|
- Figure show the displacement - time graph of a particle moving on the ...
Text Solution
|
- Figure given here shows the displacement time graph for a particle. Is...
Text Solution
|
- दिया गया चित्र x-अक्ष पर गतिमान किसी कण की चाल के विस्थापन-समय (-1) ग्...
Text Solution
|