Text Solution
Verified by Experts


Similar Questions
Explore conceptually related problems
Recommended Questions
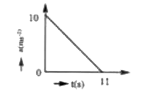
- The a -t graph is shown in the figure. The maximum velocity attained b...
Text Solution
|
- A body starts from rest at time t = 0 , the acceleration time graph is...
Text Solution
|
- The graph shown the variation of velocity of a rocket with time. Then,...
Text Solution
|
- A particle starts from rest and undergoes an acceleration as shown in ...
Text Solution
|
- In figure shown, the graph shows the variation of acceleration of body...
Text Solution
|
- A rocket is projected vertically upwards and its time velocity graph i...
Text Solution
|
- A particle starts moving from rest in a from rest in a straight line. ...
Text Solution
|
- A particle starting from rest undergoes a rectilinear motion with acce...
Text Solution
|
- The graph in figure shows the velocity v versus time t for a body. Whi...
Text Solution
|