A
B
C
D
Text Solution
Verified by Experts
The correct Answer is:


Similar Questions
Explore conceptually related problems
Recommended Questions
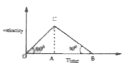
- The velocity - time graph of a body is shown in fig. The ratio of the ...
Text Solution
|
- The velocity time graph of a body moving along a straight line is show...
Text Solution
|
- The graph between the displacement x and time t for a particle moving ...
Text Solution
|
- The velocity-time graph of a body is shown in figure. The ratio of mag...
Text Solution
|
- The velocity time graph of a body is shown in fig. it indicates that :
Text Solution
|
- On a velocity time graph of a body, the ratio of average acceleration ...
Text Solution
|
- The velocity time graph of a body moving along a straight line is show...
Text Solution
|
- The velocity - time graph for two bodies A and B are in the ratio
Text Solution
|
- The graph between the displacement x and time t for a particle moving ...
Text Solution
|