A
B
C
D
Text Solution
Verified by Experts
The correct Answer is:


Similar Questions
Explore conceptually related problems
Recommended Questions
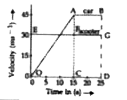
- The velocity-time graphs of a car and a scooter are shown in the figur...
Text Solution
|
- As soon as a car just starts from rest in a certain dercation, a scoot...
Text Solution
|
- As soon as a car starts from rest in a certain dirction, a scooter mov...
Text Solution
|
- As soon as a car just starts from rest in a certain direction, a scoot...
Text Solution
|
- A scooter starts from rest have an acceleration of 1 ms^(-2) while a c...
Text Solution
|
- In which year is the difference between the sales of the scooters and ...
Text Solution
|
- The velocity-time graphsof a car and a scooter are shown in the figure...
Text Solution
|
- Which air pollutant is not released by scooters and cars?
Text Solution
|
- What is the maximum separation between car and scooter ?
Text Solution
|