A
B
C
D
Text Solution
Verified by Experts
The correct Answer is:


Similar Questions
Explore conceptually related problems
Recommended Questions
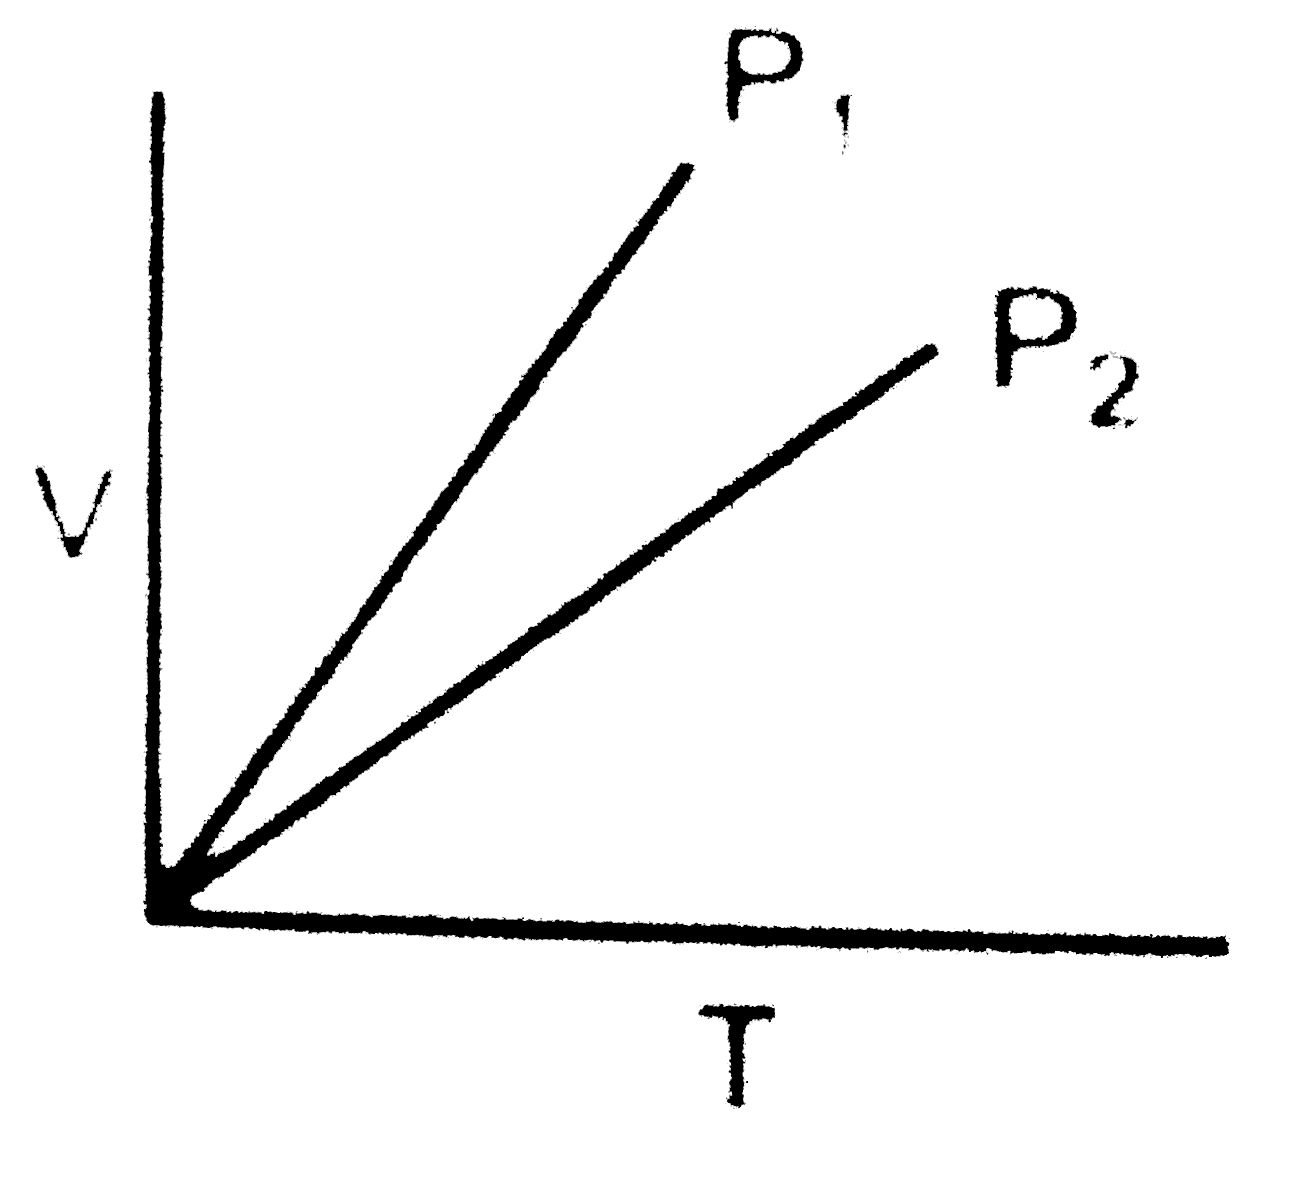
- V versus T curves at constant pressure P(1)" and "P(2) for an ideal ga...
Text Solution
|
- V vs T curves at different pressures P(1) and P(2) for an ideal gas ar...
Text Solution
|
- Volume versus temperature graphs for a given mass of an ideal gas are ...
Text Solution
|
- For an ideal gas V - T curves at constant pressure P(1) & P(2) are sho...
Text Solution
|
- Pressure versus temperature graph of an ideal gas is shown in figure. ...
Text Solution
|
- For V versus T curves at constant pressure P1 and P2 for and ideal gas...
Text Solution
|
- V vs T curves at constant pressure P(1) and P(2) for an ideal gas are ...
Text Solution
|
- Volume versus temperature graphs for a given mass of an ideal gas are ...
Text Solution
|
- Volume versus temperature graphs for a given mass of an ideal gas are ...
Text Solution
|