A
B
C
D
Text Solution
Verified by Experts
The correct Answer is:


Similar Questions
Explore conceptually related problems
Recommended Questions
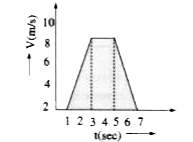
- For the velocity - time graph shown in figure below the distance cover...
Text Solution
|
- A body falls freely from rest. It covers as much distance in the last ...
Text Solution
|
- For the velocity tiem graph shown in Fig. 2 (CF).14, the distance cove...
Text Solution
|
- नीचे दर्शाए वेग-समय ग्राफ के लिए अंतिम दो सेकंड में पिंड द्वारा तय की ...
Text Solution
|
- IF a freely falling body covers halfs of its total distance in the las...
Text Solution
|
- A body falls from rest. In the last second of its fall, it covers half...
Text Solution
|
- A stone falls from rest. The total distance covered by it in the last ...
Text Solution
|
- For the velocity time graph shown in the figure below the distance cov...
Text Solution
|
- A body falls from rest. In the last second of its fall, it covers half...
Text Solution
|