A
B
C
D
Text Solution
Verified by Experts
The correct Answer is:


Similar Questions
Explore conceptually related problems
Recommended Questions
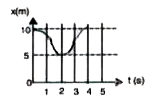
- The x-t plot of a car is shown in the figure. The average velocity is ...
Text Solution
|
- Figure shows x-t graph of a particle. Find the Time T Such that the Av...
Text Solution
|
- The velocity-time plot is shown in figure. Find the average speed in t...
Text Solution
|
- A car is moving on a straight road. The velocity of the car varies wit...
Text Solution
|
- A car is moving on a straight road. The velocity of the car varies wit...
Text Solution
|
- A car is moving on a straight road. The velocity of the car varies wit...
Text Solution
|
- Assertion : In the upsilon-t diagram as shown in figure, average veloc...
Text Solution
|
- चित्र में एक कण के लिए x -t ग्राफ दिखाया गया है | t का लगभग मा...
Text Solution
|
- Position - time graph for a particle is shown in figure. Starting from...
Text Solution
|