To solve the problem, we need to analyze the motion of the car in two distinct phases: the acceleration phase and the uniform velocity phase.
### Step-by-Step Solution:
1. **Understanding the Motion Phases**:
- The car starts from rest, which means its initial velocity \( u = 0 \, \text{m/s} \).
- It accelerates uniformly for \( t = 4 \, \text{s} \).
- After \( 4 \, \text{s} \), the car moves with a constant (uniform) velocity until \( t = 7 \, \text{s} \).
2. **Acceleration Phase (0 to 4 seconds)**:
- Since the car is accelerating uniformly, its velocity increases linearly over time.
- The final velocity \( v \) at \( t = 4 \, \text{s} \) can be expressed as:
\[
v = u + at
\]
where \( a \) is the acceleration. Since we don't know \( a \) yet, we can denote it as \( a \).
3. **Displacement during Acceleration**:
- The displacement \( s \) during the first 4 seconds can be calculated using the equation:
\[
s = ut + \frac{1}{2} a t^2
\]
Substituting \( u = 0 \):
\[
s = \frac{1}{2} a (4^2) = 8a
\]
4. **Uniform Velocity Phase (4 to 7 seconds)**:
- After 4 seconds, the car moves with a constant velocity \( v \) for \( 3 \, \text{s} \) (from \( t = 4 \, \text{s} \) to \( t = 7 \, \text{s} \)).
- The displacement during this phase is:
\[
s = v \cdot t = v \cdot 3 = 3v
\]
- Since \( v = 4a \) (from the previous calculation), the displacement during this phase becomes:
\[
s = 3(4a) = 12a
\]
5. **Total Displacement**:
- The total displacement from \( t = 0 \) to \( t = 7 \) seconds is:
\[
\text{Total Displacement} = 8a + 12a = 20a
\]
6. **Graphical Representation**:
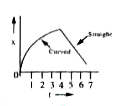
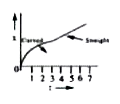
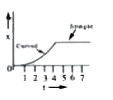
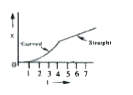
- During the first 4 seconds, the graph of displacement vs. time \( (x-t) \) will be a curve that is increasing in slope (since the velocity is increasing).
- From \( t = 4 \, \text{s} \) to \( t = 7 \, \text{s} \), the graph will be a straight line with a constant slope (since the car moves with uniform velocity).
7. **Identifying the Correct Graph**:
- We need to find a graph that shows an increasing slope from \( t = 0 \) to \( t = 4 \) seconds and a straight line from \( t = 4 \) to \( t = 7 \) seconds.
- Based on the analysis, the correct graph is the one that meets these criteria.
### Conclusion:
After evaluating the options, we find that **Option 4** is the correct representation of the car's motion up to \( t = 7 \, \text{s} \).