A

B
C
D
Text Solution
Verified by Experts


Topper's Solved these Questions
SEMICONDUCTOR DEVICES
AAKASH SERIES|Exercise EXERCISE - IB|7 VideosSEMICONDUCTOR DEVICES
AAKASH SERIES|Exercise EXERCISE - II|17 VideosSEMICONDUCTOR DEVICES
AAKASH SERIES|Exercise PROBLEMS|41 VideosRAY OPTICS
AAKASH SERIES|Exercise PROBLEMS ( LEVEL-II)|60 VideosUNITS AND MEASUREMENT
AAKASH SERIES|Exercise PRACTICE EXERCISE|45 Videos
Similar Questions
Explore conceptually related problems
AAKASH SERIES-SEMICONDUCTOR DEVICES-EXERCISE - IA
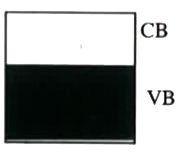
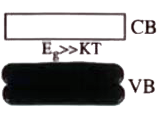
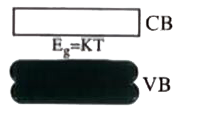
- Which of the energy band diagram shown in the figure corrensponds to t...
Text Solution
|
- The bond that exists in a semi conductor is
Text Solution
|
- A solid which is not transparent to visible light end whose conductivi...
Text Solution
|
- A piece of copper and another of germanium are cooled from room temper...
Text Solution
|
- In a semiconductor, the separation between conduction band and valence...
Text Solution
|
- The intrinsic semi conductor behaves as insulator at
Text Solution
|
- The energy gap for an insulator may be
Text Solution
|
- In case of a semi conductor, which one of the following statements is ...
Text Solution
|
- An electric field us applied to a semiconductor.Let the number of char...
Text Solution
|
- Lets npand ne be the number of holes and conduction electrons in an in...
Text Solution
|
- When an impurity is doped into an intrinsic semiconductor, the conduct...
Text Solution
|
- Diffusion current in a p-n junction is greater than the drift current ...
Text Solution
|
- In an intrinsic semiconductor, the fermi energy level lies
Text Solution
|
- The mobility of free electron is greater than that of free holes becau...
Text Solution
|
- The value indicated by fermi-energy level in an intrinsic semiconducto...
Text Solution
|
- A semiconducting device is connected in a series in circuit with a bat...
Text Solution
|
- Pure semiconductor is known as
Text Solution
|
- A doped semiconductor is
Text Solution
|
- The potential barrier, in the depletion layer , is due to
Text Solution
|
- A P-type semiconductor can be formed by doping Si or Ge with
Text Solution
|