Text Solution
Verified by Experts


Similar Questions
Explore conceptually related problems
Recommended Questions
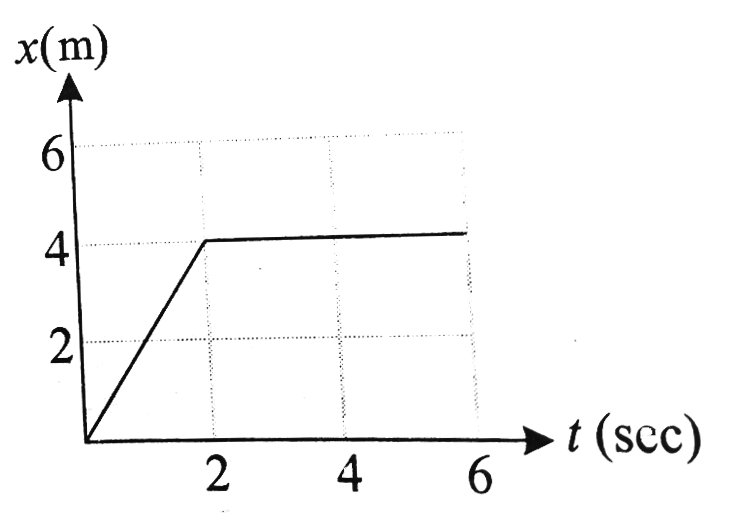
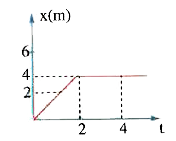
- In the figure given below, the position-time graph of a particle of ma...
Text Solution
|
- In the figure given below, the position-time graph of a particle of ma...
Text Solution
|
- In the figure given below, the position time graph of a particle of ma...
Text Solution
|
- The position-time graph of a body of mass 2 kg is as given in figure ....
Text Solution
|
- The position-time graph of a particle of mass 0.1 kg is shown. The imp...
Text Solution
|
- In the figure, the position time graph of a particle of mass 0.1 kg is...
Text Solution
|
- In the figure given below, the position–time graph of a particle of ma...
Text Solution
|
- In the figure given, the position-time graph of a particle of mass 0.1...
Text Solution
|
- 2 किग्रा द्रव्यमान के के पिण्ड का स्थिति-समय ग्राफ चित्र में दिखाए अनु...
Text Solution
|