Text Solution
Verified by Experts


Similar Questions
Explore conceptually related problems
Recommended Questions
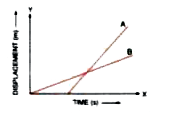
- Fig. 2.33 shows displacement-time graph of two vehicles A and B moving...
Text Solution
|
- A vehicle is moving with uniform speed along horizontal, concave and c...
Text Solution
|
- When a vehicle is moving along the horizontal curve road, centripetal ...
Text Solution
|
- The velocity-time graph of a particle moving along a straight line is ...
Text Solution
|
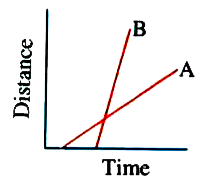
- From the given displacement - time graph of two cars moving on a str...
Text Solution
|
- A vehicle is moving on a rough road in a straight line with uniform ve...
Text Solution
|
- A vehicle is moving on a rough road in a straight line with uniform ve...
Text Solution
|
- समरूप चाल से गतिमान वाहन का दूरी -समय ग्राफ दिखाएँ |
Text Solution
|
- सड़क के किनारे खड़े एक वाहन का दूरी -समय ग्राफ दिखाएँ ।
Text Solution
|