


Similar Questions
Explore conceptually related problems
Recommended Questions
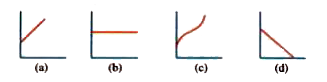
- The figure below shows four graphs of x versus time,which graph shows ...
Text Solution
|
- The acceleration versus time graph of a particle moving in a straight ...
Text Solution
|
- Figure gives the velocity-time graph. This shows that the body is.
Text Solution
|
- Figure shows the position the graph for a particle in one dimensional ...
Text Solution
|
- Figure shows a velocity-time graph. This shows that.
Text Solution
|
- The graph below shws the velocity versus time graph for a body Wh...
Text Solution
|
- Figure shows some velocity versus time graphs : , , , Only some o...
Text Solution
|
- The velocity-time graph of an object is shown below. The part of the g...
Text Solution
|
- The graph in figure shows the velocity v versus time t for a body. Whi...
Text Solution
|