Home
Class 12
BIOLOGY
The following graph depicts changes in t...

The following graph depicts changes in two populations (A and B) of herbivores in a grassy field A possible reason for these changes is that

A

Population A produced more offspring than population B

B

Population A consumed the members of population B

C

Both plant populations in this habitat decreases

D

Population B competed more successfully for food than population A

Text Solution

Verified by Experts

The correct Answer is:
D
Promotional Banner

Topper's Solved these Questions

  • ORGANISMS AND POPULATIONS

    AAKASH SERIES|Exercise EXERCISE-II (POPULATION INTERACTIONS)|1 Videos
  • NEURAL CONTROL AND COORDINATION

    AAKASH SERIES|Exercise EXERCISE-III( PREVIOUS AIPMT / NEET QUESTIONS)|33 Videos
  • PHOTOSYNTHESIS IN HIGHER PLANTS

    AAKASH SERIES|Exercise Exercise - III|27 Videos

Similar Questions

Explore conceptually related problems

The following graph depicts changes in two populations (A and B) of herbivores in a grassy field. A possible reson for these changes is that

Which of the following graphs best depicts the changes in one cycle of PCR ?

Give the formula for the change in population size.

The following graphs (A and B) depicts changes in DNA Content during cell cycle. Identify the cell divison from A and B :-

The accompanying figure depicts a change in concentration of species A and B for the reaction ArarrB , as a function of time. The point of inter section of the two curves represents

Study the set-up shown in the diagram and answer the following: What change will you observe in part 'B' of the setup after one hour? Give reason for this change.

A population of horses is split into two population by a new river bed that forms after a flood. After many generations,the river changes course and the population mix again. Which of the following indicates that the two population have formed two separate species?

The change of frequency of alleles in a population by chance is called :

The frequency of an allele in an isolated population may change due to

The frequency of an allele in an isolated population may change due to

AAKASH SERIES-ORGANISMS AND POPULATIONS-EXERCISE-III (PREVIOUS AIPMT/NEET QUESTIONS)
  1. In which of the following intersections both partners are adversely af...

    Text Solution

    |

  2. An association of individuals of different species living in the same ...

    Text Solution

    |

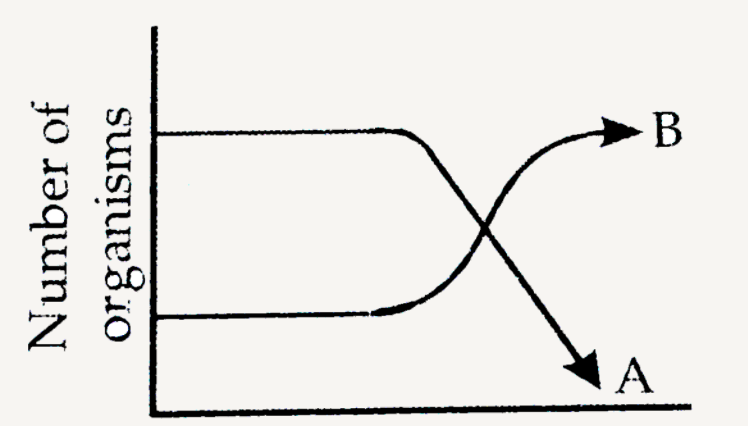
  3. The following graph depicts changes in two populations (A and B) of he...

    Text Solution

    |

  4. Just as a person moving from Delhi to Shimla, escape the heat for the ...

    Text Solution

    |

  5. Besides paddy fields, cyanobacteria are also found inside vegetative p...

    Text Solution

    |

  6. A sedentary sea anemone gets attached to the shell lining of hermit cr...

    Text Solution

    |

  7. A biologist studied the population of rats in a barn. He found that th...

    Text Solution

    |

  8. The age pyramid with broad base indicates

    Text Solution

    |

  9. Which of the following is not a parasitic adaptation?

    Text Solution

    |

  10. Benthic organisms are affected most by

    Text Solution

    |

  11. Cuscuta is an example of a

    Text Solution

    |

  12. What type of human population is represented by the following age pyra...

    Text Solution

    |

  13. Large woody Vines are more commonly found in

    Text Solution

    |

  14. Consider the following four conditions (i-iv) and select the correct p...

    Text Solution

    |

  15. Which one of the following is categorised as a parasite in true sence ...

    Text Solution

    |

  16. The logiostic population growth is expressed by the equation

    Text Solution

    |

  17. The figure given below is a diagrammatic representation of response of...

    Text Solution

    |

  18. Which one of the following is one of the characteristics of a biologic...

    Text Solution

    |

  19. Which one of the following is most appropriately defined ?

    Text Solution

    |

  20. A country with a high rate of population growth took measures to reduc...

    Text Solution

    |