A
B
C
D
Text Solution
Verified by Experts
The correct Answer is:


Similar Questions
Explore conceptually related problems
Recommended Questions
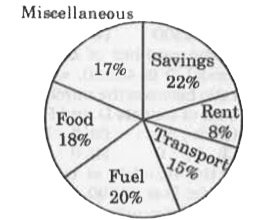
- The pie chart given below shows the expenditure (in percentage) of Mah...
Text Solution
|
- Match the following Column A to Column B
Text Solution
|
- The inequation represented by the graph given below is : <img src="htt...
Text Solution
|
- The inequation that best describes the graph given below is <img src=...
Text Solution
|
- What is the average monthly income of a man if he saves Rs.85000 durin...
Text Solution
|
- Directions : The pie-chart given below shows expenditure incurred by a...
Text Solution
|
- The pie-chart given below shows the distribution of monthly expenditur...
Text Solution
|
- The pie chart given below shows the expenditure (in percentage) of Mah...
Text Solution
|
- The pie chart given below shows the expenditure (in percentage) of Mah...
Text Solution
|