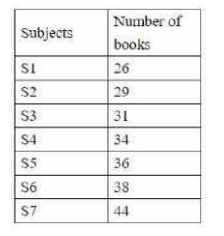
 The number of books of S3 is what percent (correct to one decimal place) of the average number of Science books?
 A
B
C
D
Text Solution
Verified by Experts
The correct Answer is:


Similar Questions
Explore conceptually related problems
Recommended Questions
- The table given below presents the number of books on different subjec...
Text Solution
|
- The pictograph shows different subject books which are kept in a li...
Text Solution
|
- Determine the point of symmetry of a regular hexagon. <img src="htt...
Text Solution
|
- Match the following Column A to Column B
Text Solution
|
- Match the following Column A to Column B
Text Solution
|
- Match the following Column A to Column B
Text Solution
|
- Find the area of figure given below.
Text Solution
|
- Find the perimeter of the figure given below.
Text Solution
|
- Find the area of the figure given below.
Text Solution
|