 Total export of coffee is approximately what percent more than the total export of tea during
the five years?
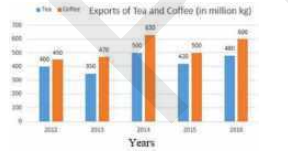
Total export of coffee is approximately what percent more than the total export of tea during
the five years? A
B
C
D
Text Solution
Verified by Experts
The correct Answer is:


Similar Questions
Explore conceptually related problems
Recommended Questions
- The given Bar Graph presents the Export of Tea and Coffee (in million ...
Text Solution
|
- Match the following Column A to Column B
Text Solution
|
- The inequation represented by the graph given below is : <img src="htt...
Text Solution
|
- The inequation that best describes the graph given below is <img src=...
Text Solution
|
- The inequation that best describes the following graph is <img src="h...
Text Solution
|
- The total surface area of the given solid figure is .
Text Solution
|
- The given Bar Graph presents the Export of Tea and Coffee (in million ...
Text Solution
|
- Export of tea and coffee (in million kilograms) What was the percentag...
Text Solution
|
- Export of tea and coffee (in million kilograms) What was the ratio of ...
Text Solution
|