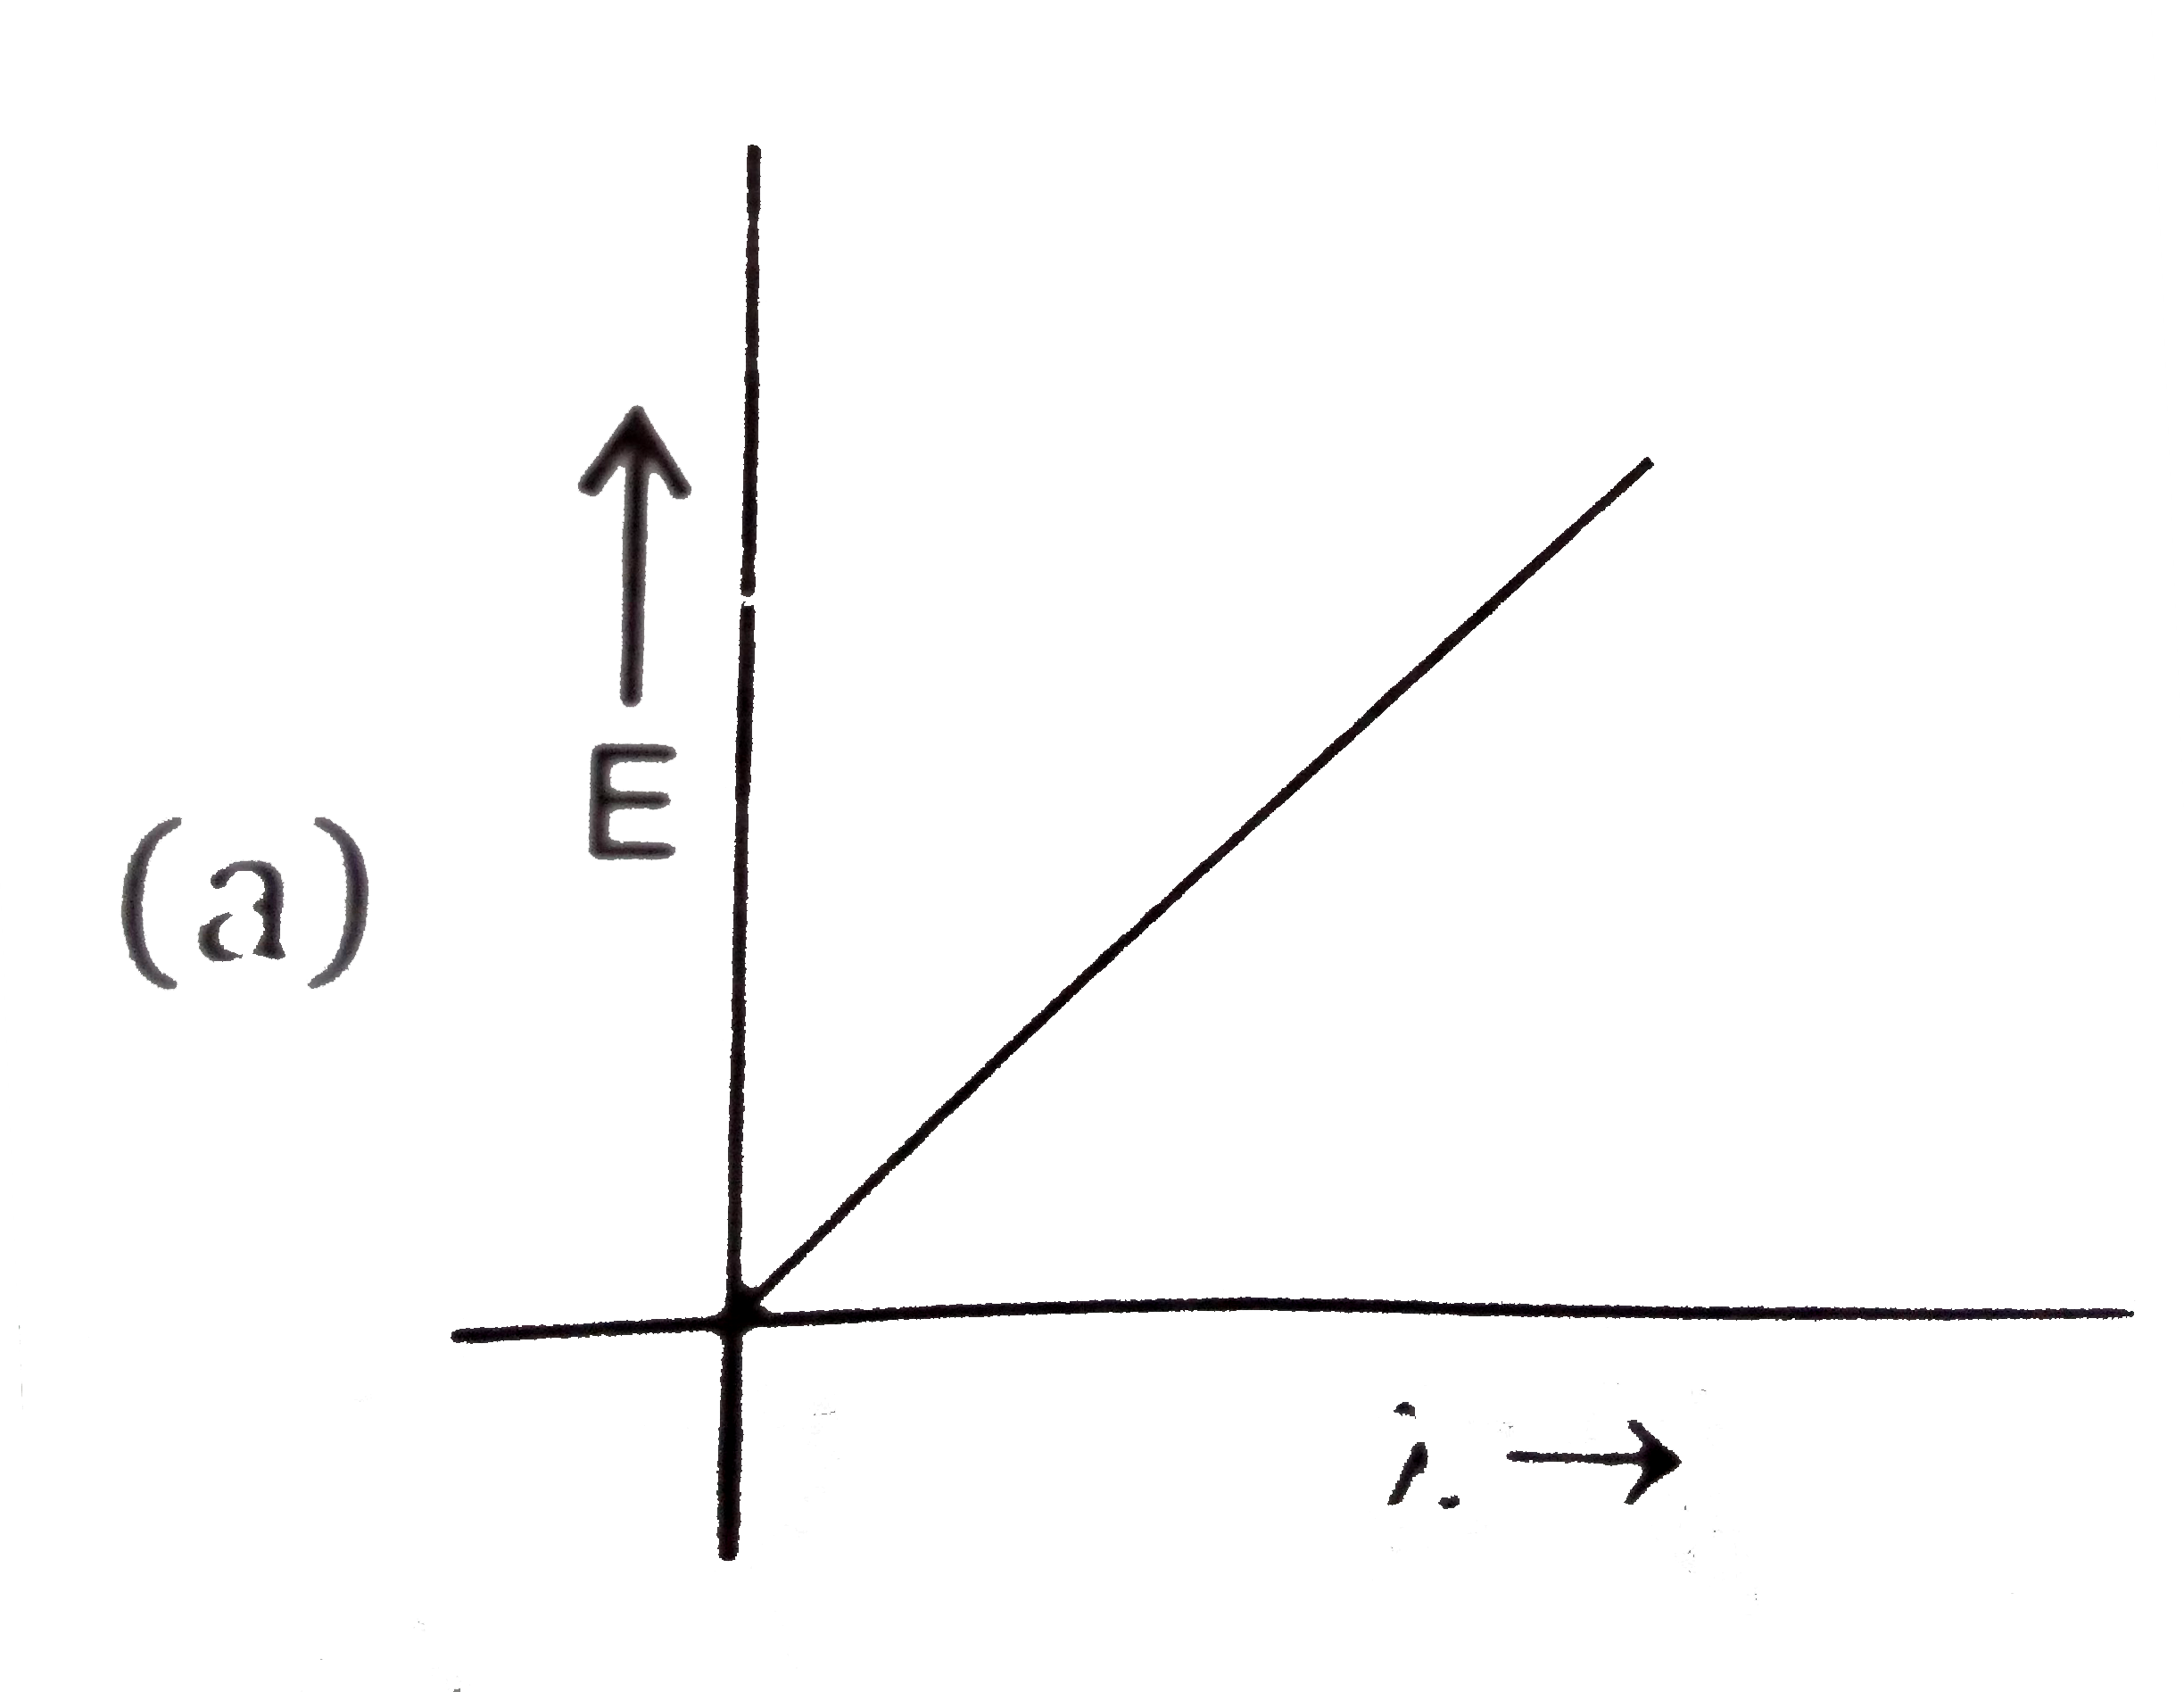
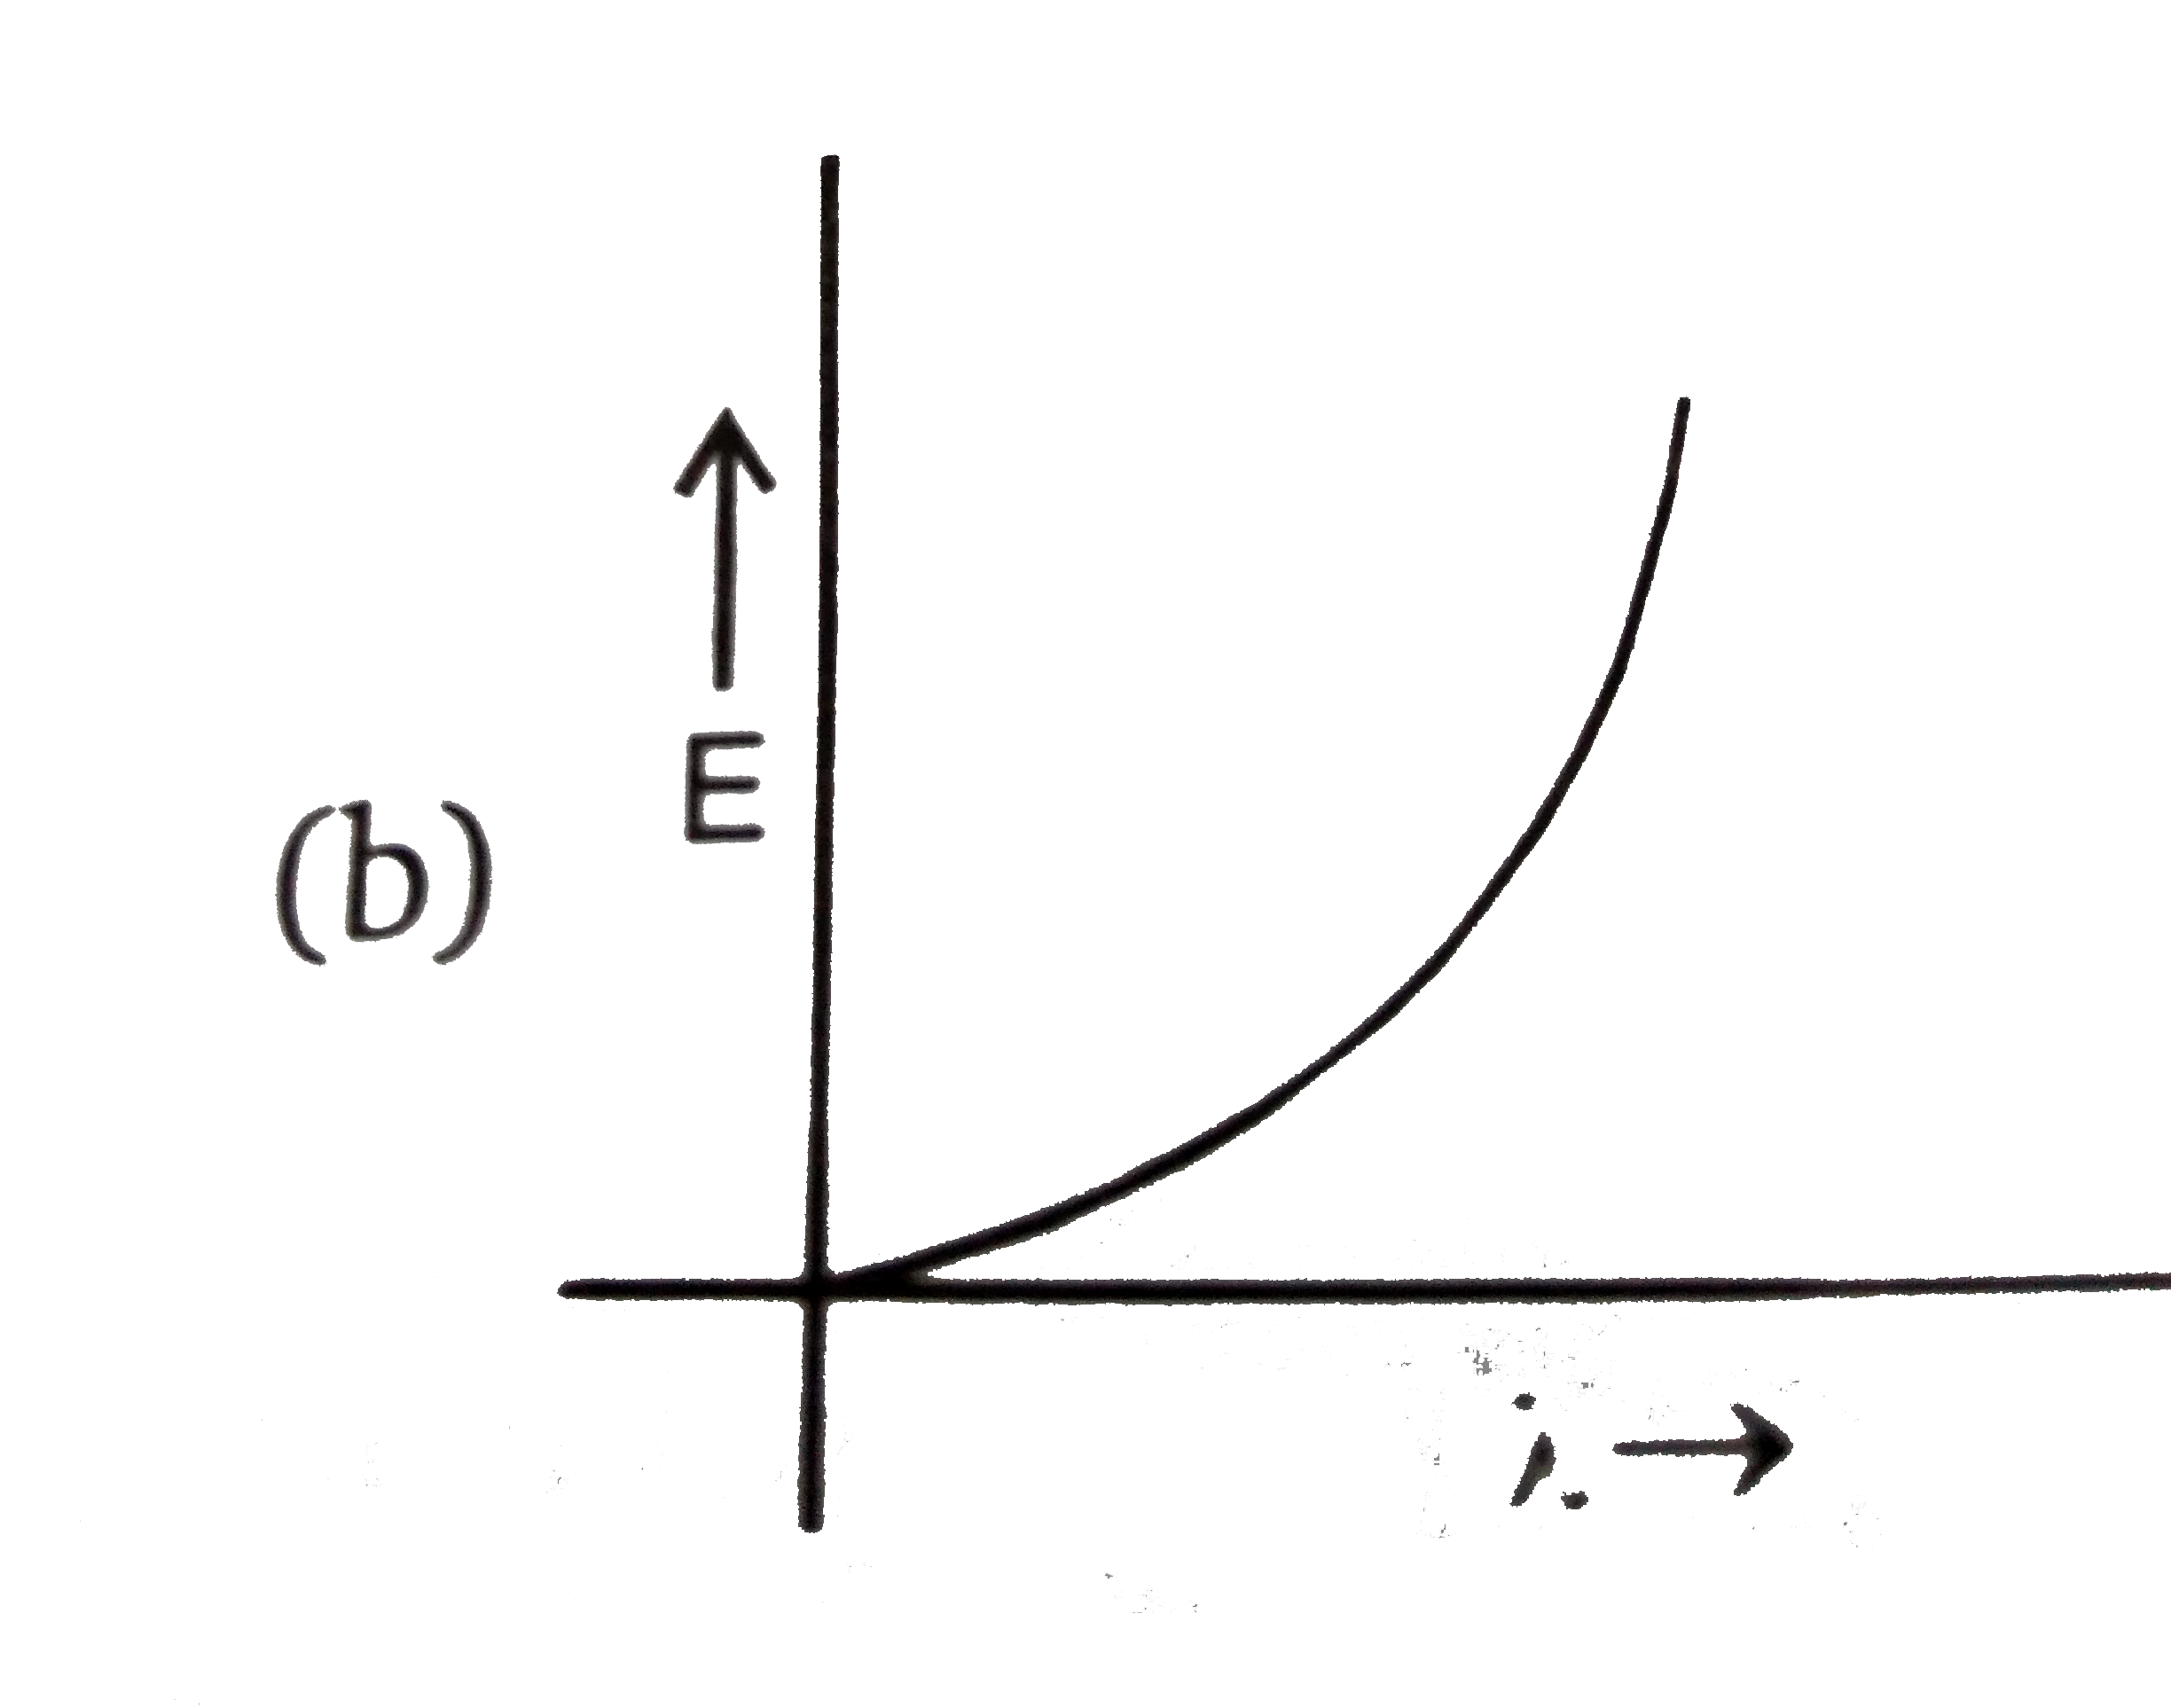
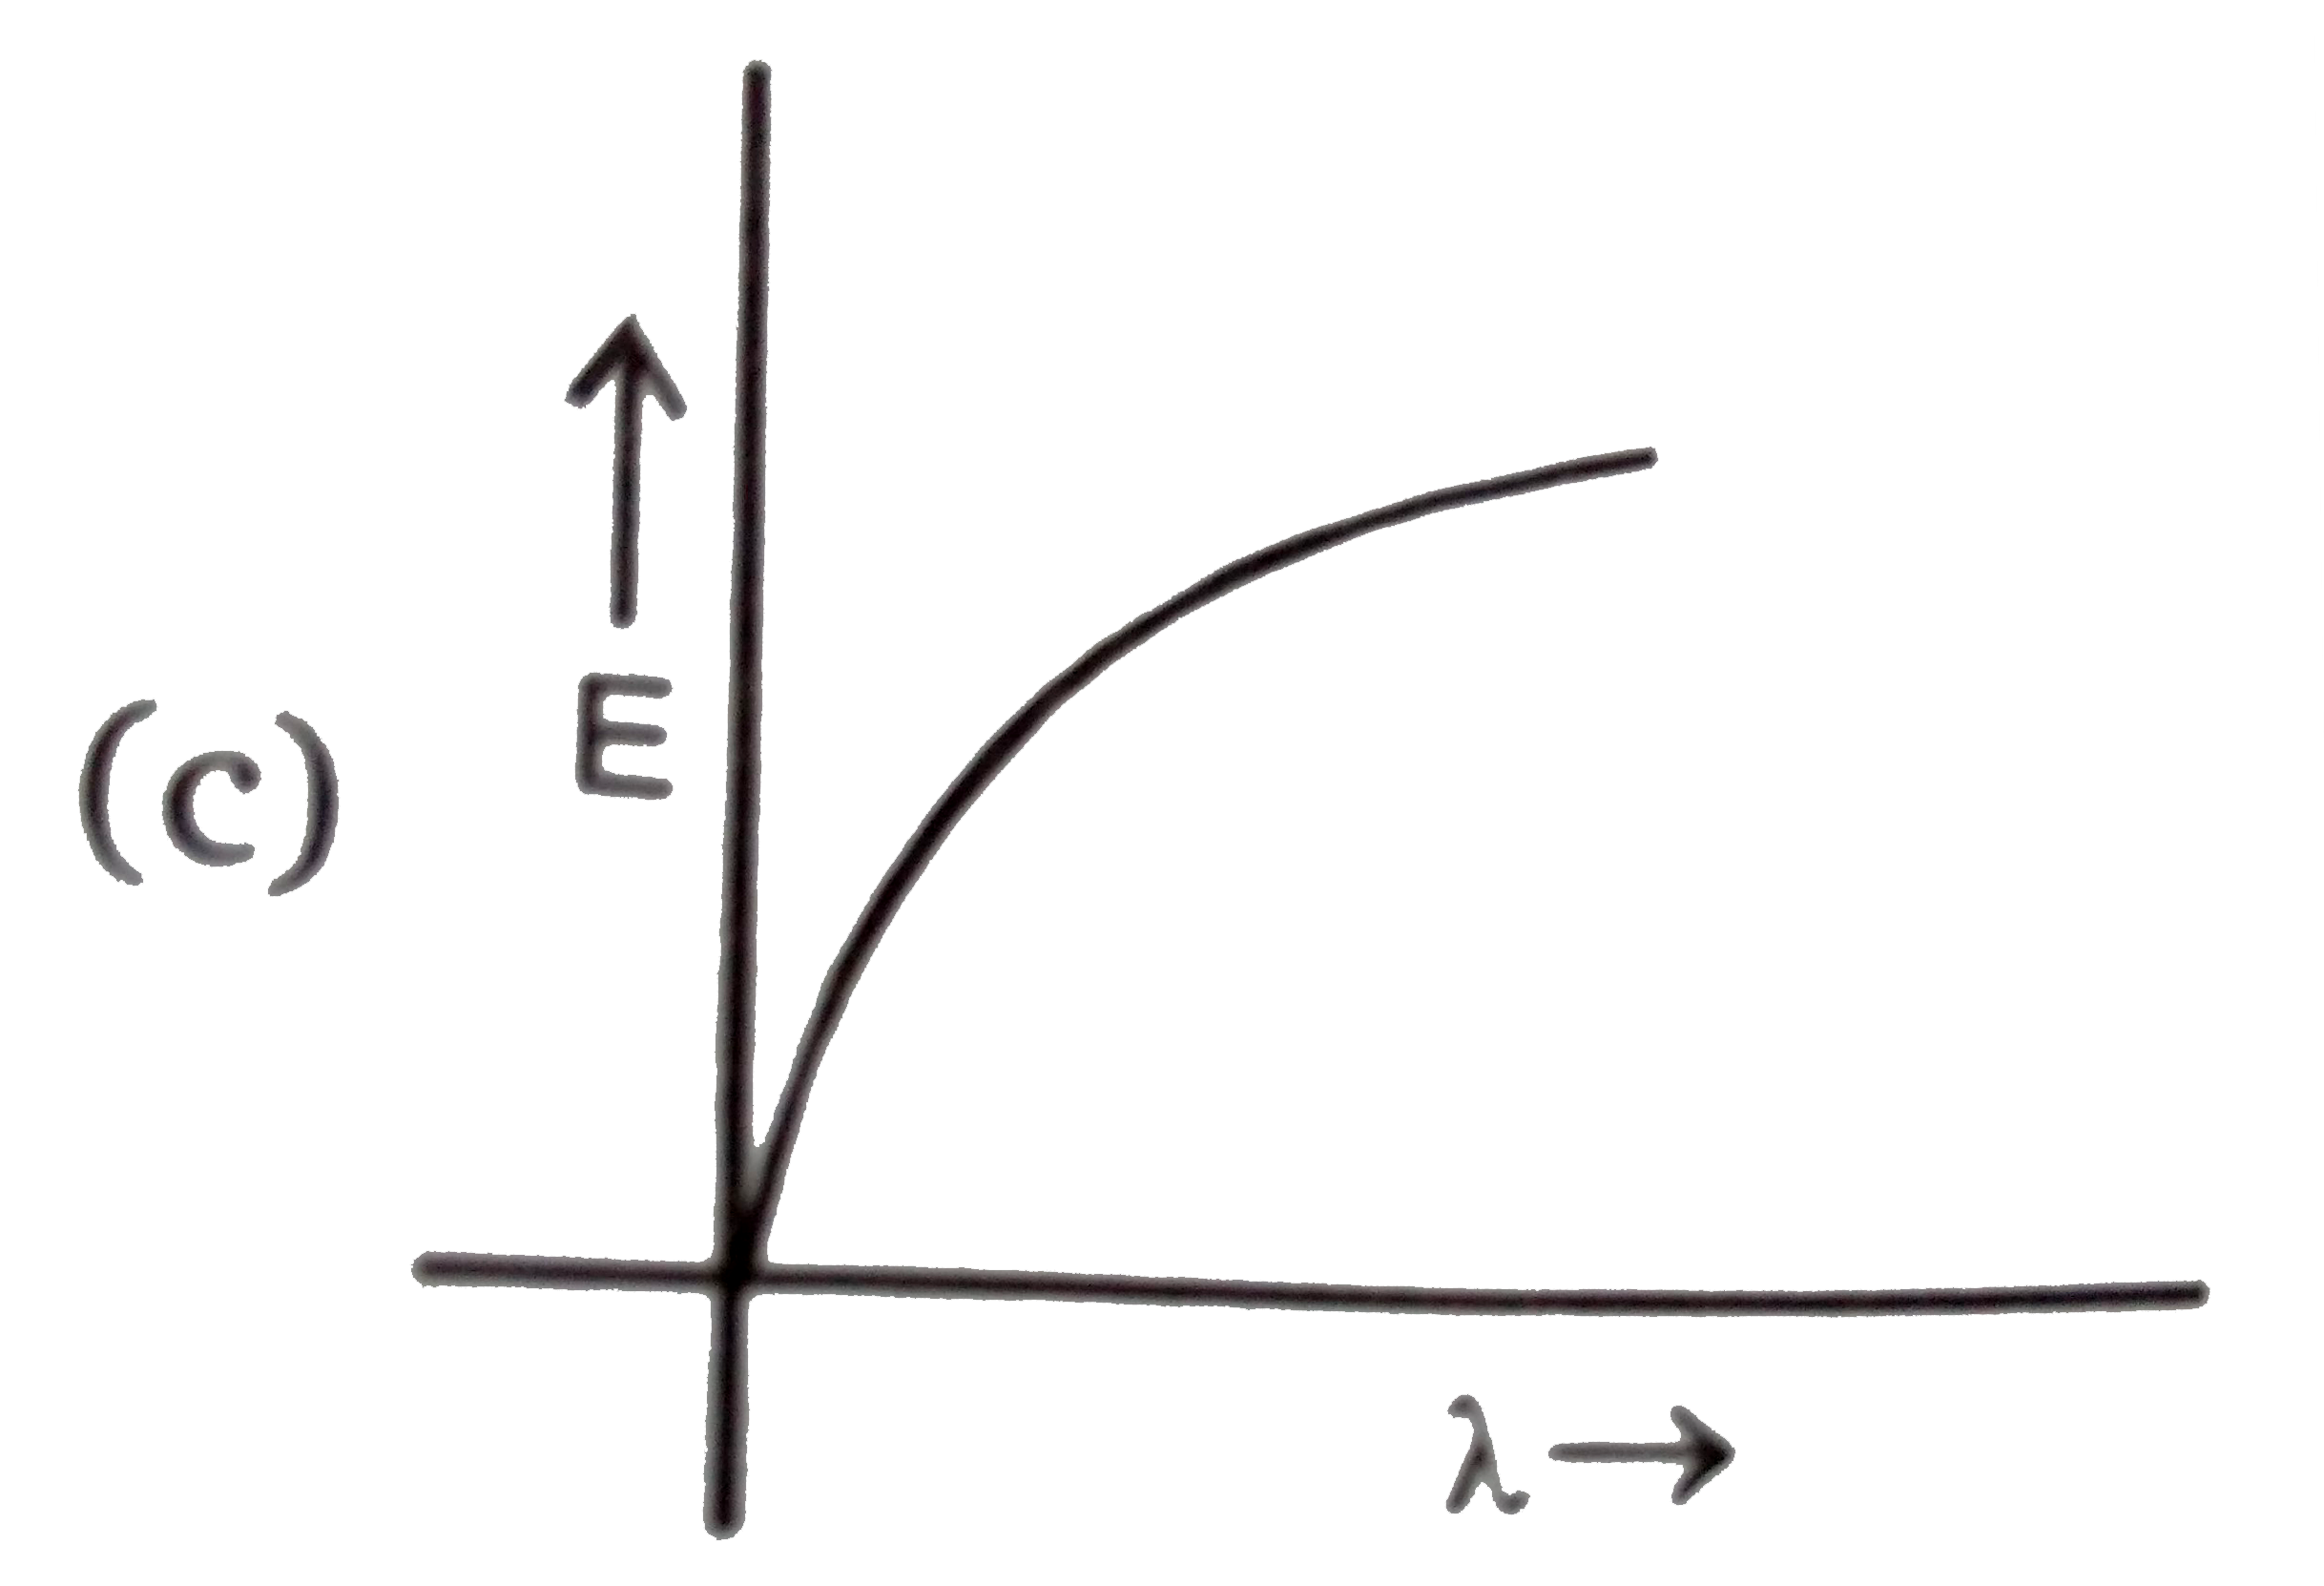
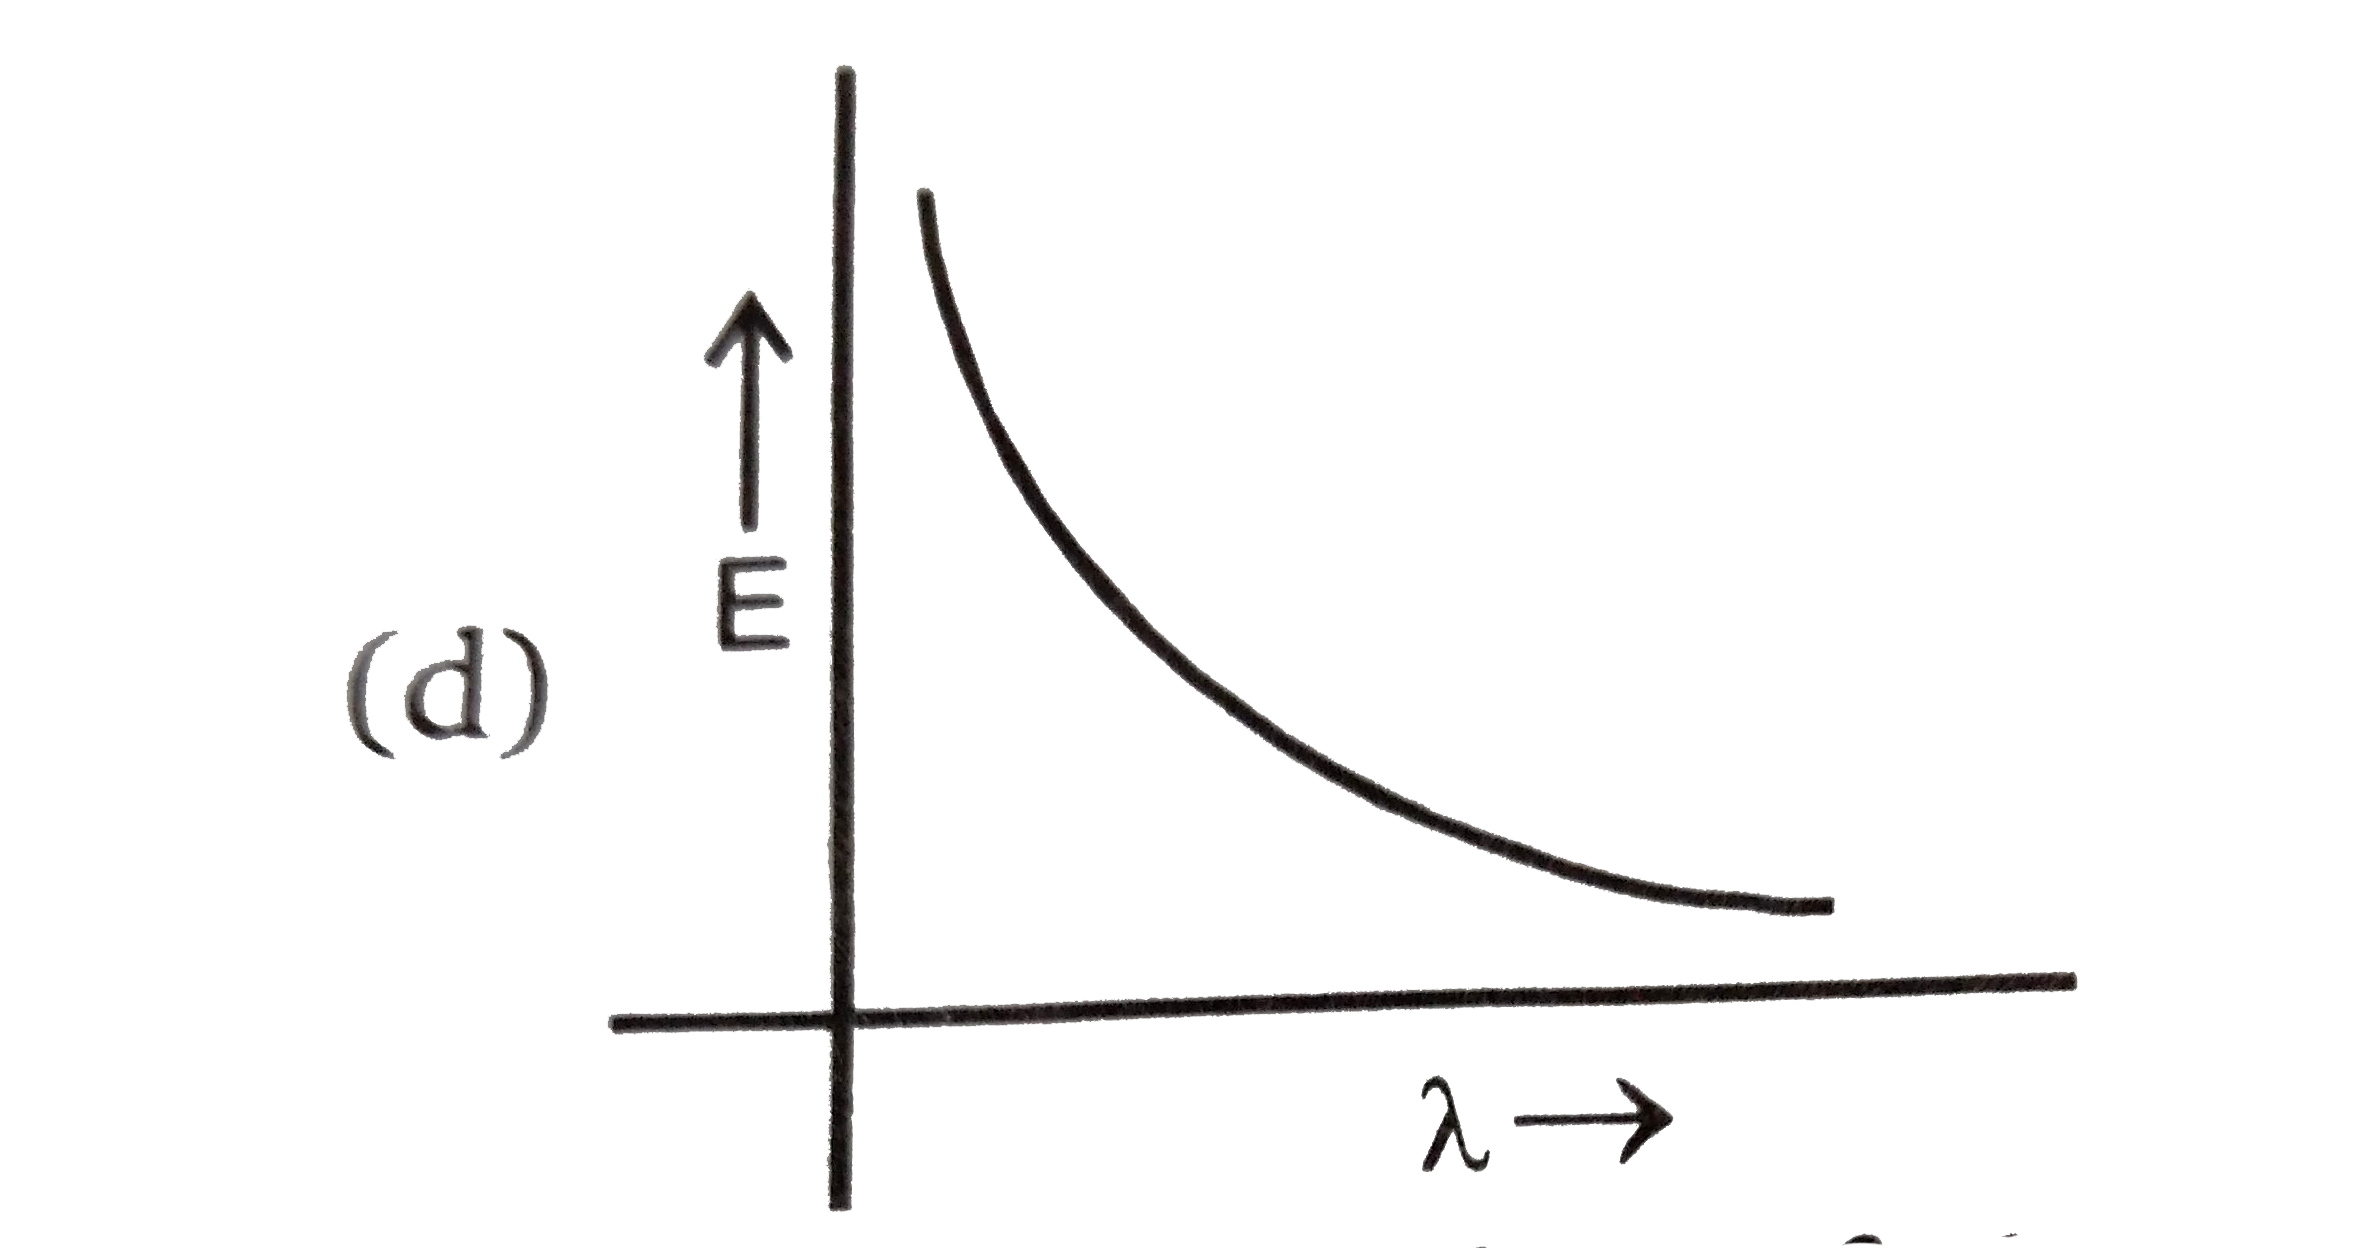
Which graph shows how the energy E of a photon of light is related to its wavelengths `(lamda)`?
A
B
C
D
Text Solution
Verified by Experts
Topper's Solved these Questions
ATOMIC STUCTURE
NARENDRA AWASTHI|Exercise Level- 1|1 Videos
ATOMIC STUCTURE
NARENDRA AWASTHI|Exercise level 2|1 Videos
CHEMICAL EQUILIBRIUM
NARENDRA AWASTHI|Exercise Level 2|1 Videos
Similar Questions
Explore conceptually related problems
Which colour of light has shortest wavelength ?
The energy of a photon is inversely propor tional to its
How wavelength and velocity of light related?
The energy of an x-ray photon is 4 kev. Its frequency is nearly
the energy of photon is equal to the kinetic energy of a porton,If lambda_1 is the De-Broglie wavelength of a proton, lambda_2 the wavelength associated with the proton and if the energt of the protonis E, then (lamda_1//lambda_2) is proportional to
The graph showing rate of Photosynthesis at different wavelengths of light is called
K_(1) and K_(2) are the maximum kinetic energies of the photo electrons emitted when light of wave lengths lamda_(1) , and lamda_(2) , respectively are incident on a metallic surface. If lamda_(1)=3lamda_(2) then