Home
Class 11
CHEMISTRY
P-V plot for two gases (assuming ideal) ...

`P-V` plot for two gases (assuming ideal) during adiabatic processes are given in the figure. Plot `A` and Plot `B` should correspond respectively to:

A

He and `H_(2)`

B

`H_(2)` and He

C

He and Ne

D

`H_(2)` and `Cl_(2)`

Text Solution

Verified by Experts

The correct Answer is:
B

PV = constant for isothermal process `PV^(gamma)` = constant for adiabatic process so more is the value of `gamma`, more is decrease in pressure.
Promotional Banner

Topper's Solved these Questions

  • THERMODYNAMICS

    NARENDRA AWASTHI|Exercise Level 1 (Q.1 To Q.30)|6 Videos
  • THERMODYNAMICS

    NARENDRA AWASTHI|Exercise Level 1 (Q.31 To Q.60)|2 Videos
  • STOICHIOMETRY

    NARENDRA AWASTHI|Exercise Level 3 - Subjective Problems|20 Videos

Similar Questions

Explore conceptually related problems

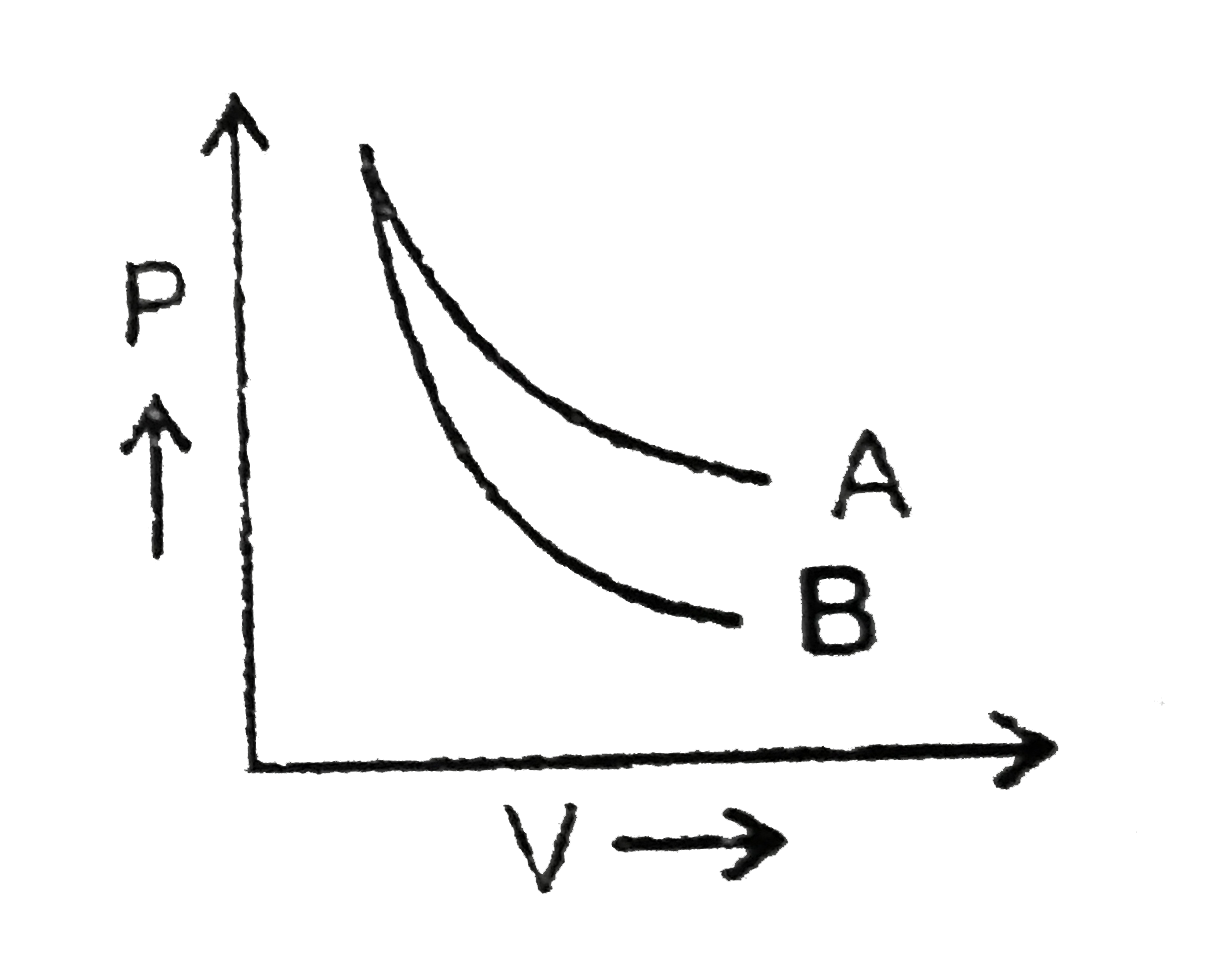
The variation of pressure P with volume V for an ideal monoatomic gas during an adiabatic process is shown in figure. At point A the magnitude of rate of change of pressure with volume is

The variation of compressibility factor (Z) with pressure (p in bar) for some gases are shown in the figure below. Identify the gases (A) ,(B) and (C ) respectively

P-V diagram of an ideal gas is shown in the figure. Work done by the gas in the process ABCD is

An ideal gas undergoes cyclic process ABCDA as shown in given P-V diagram. The amount of work done by the gas is