A
B
C
D
Text Solution
Verified by Experts
The correct Answer is:


Similar Questions
Explore conceptually related problems
Recommended Questions
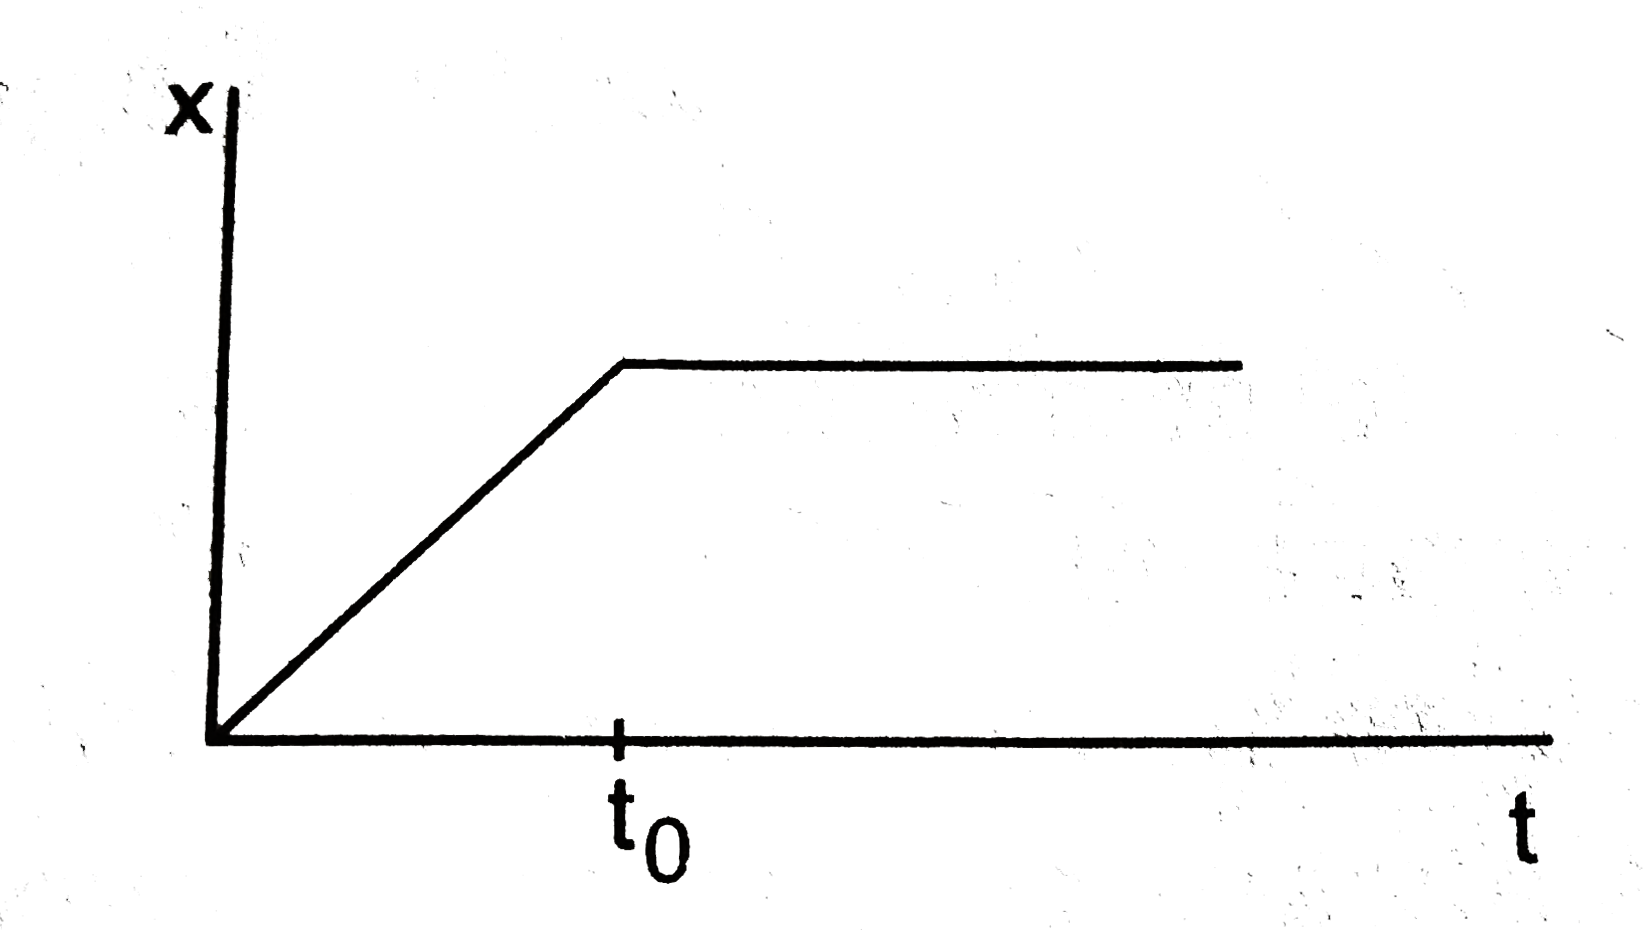
- Figure shows the displacement time graph of a particle moving on the X...
Text Solution
|
- Figure shows the displacement time graph of a particle moving on the X...
Text Solution
|
- The velocity-time graph for a particle moving along X-axis is shown in...
Text Solution
|
- For a particle moving along x-axis, velocity-time graph is as shown in...
Text Solution
|
- The velocity time graph for a particle moving along x-axis is shown in...
Text Solution
|
- चित्र में x - अक्ष पर चलते एक कण का विस्थापन - समय ग्राफ दि...
Text Solution
|
- Figure shows the position-time graph of a particle moving on the X--ax...
Text Solution
|
- Figure shows the displacement (x)-time (f) graph of a particle moving ...
Text Solution
|
- The velocity time graph for a particle moving along X-axis is shown in...
Text Solution
|