Text Solution
Verified by Experts


Similar Questions
Explore conceptually related problems
Recommended Questions
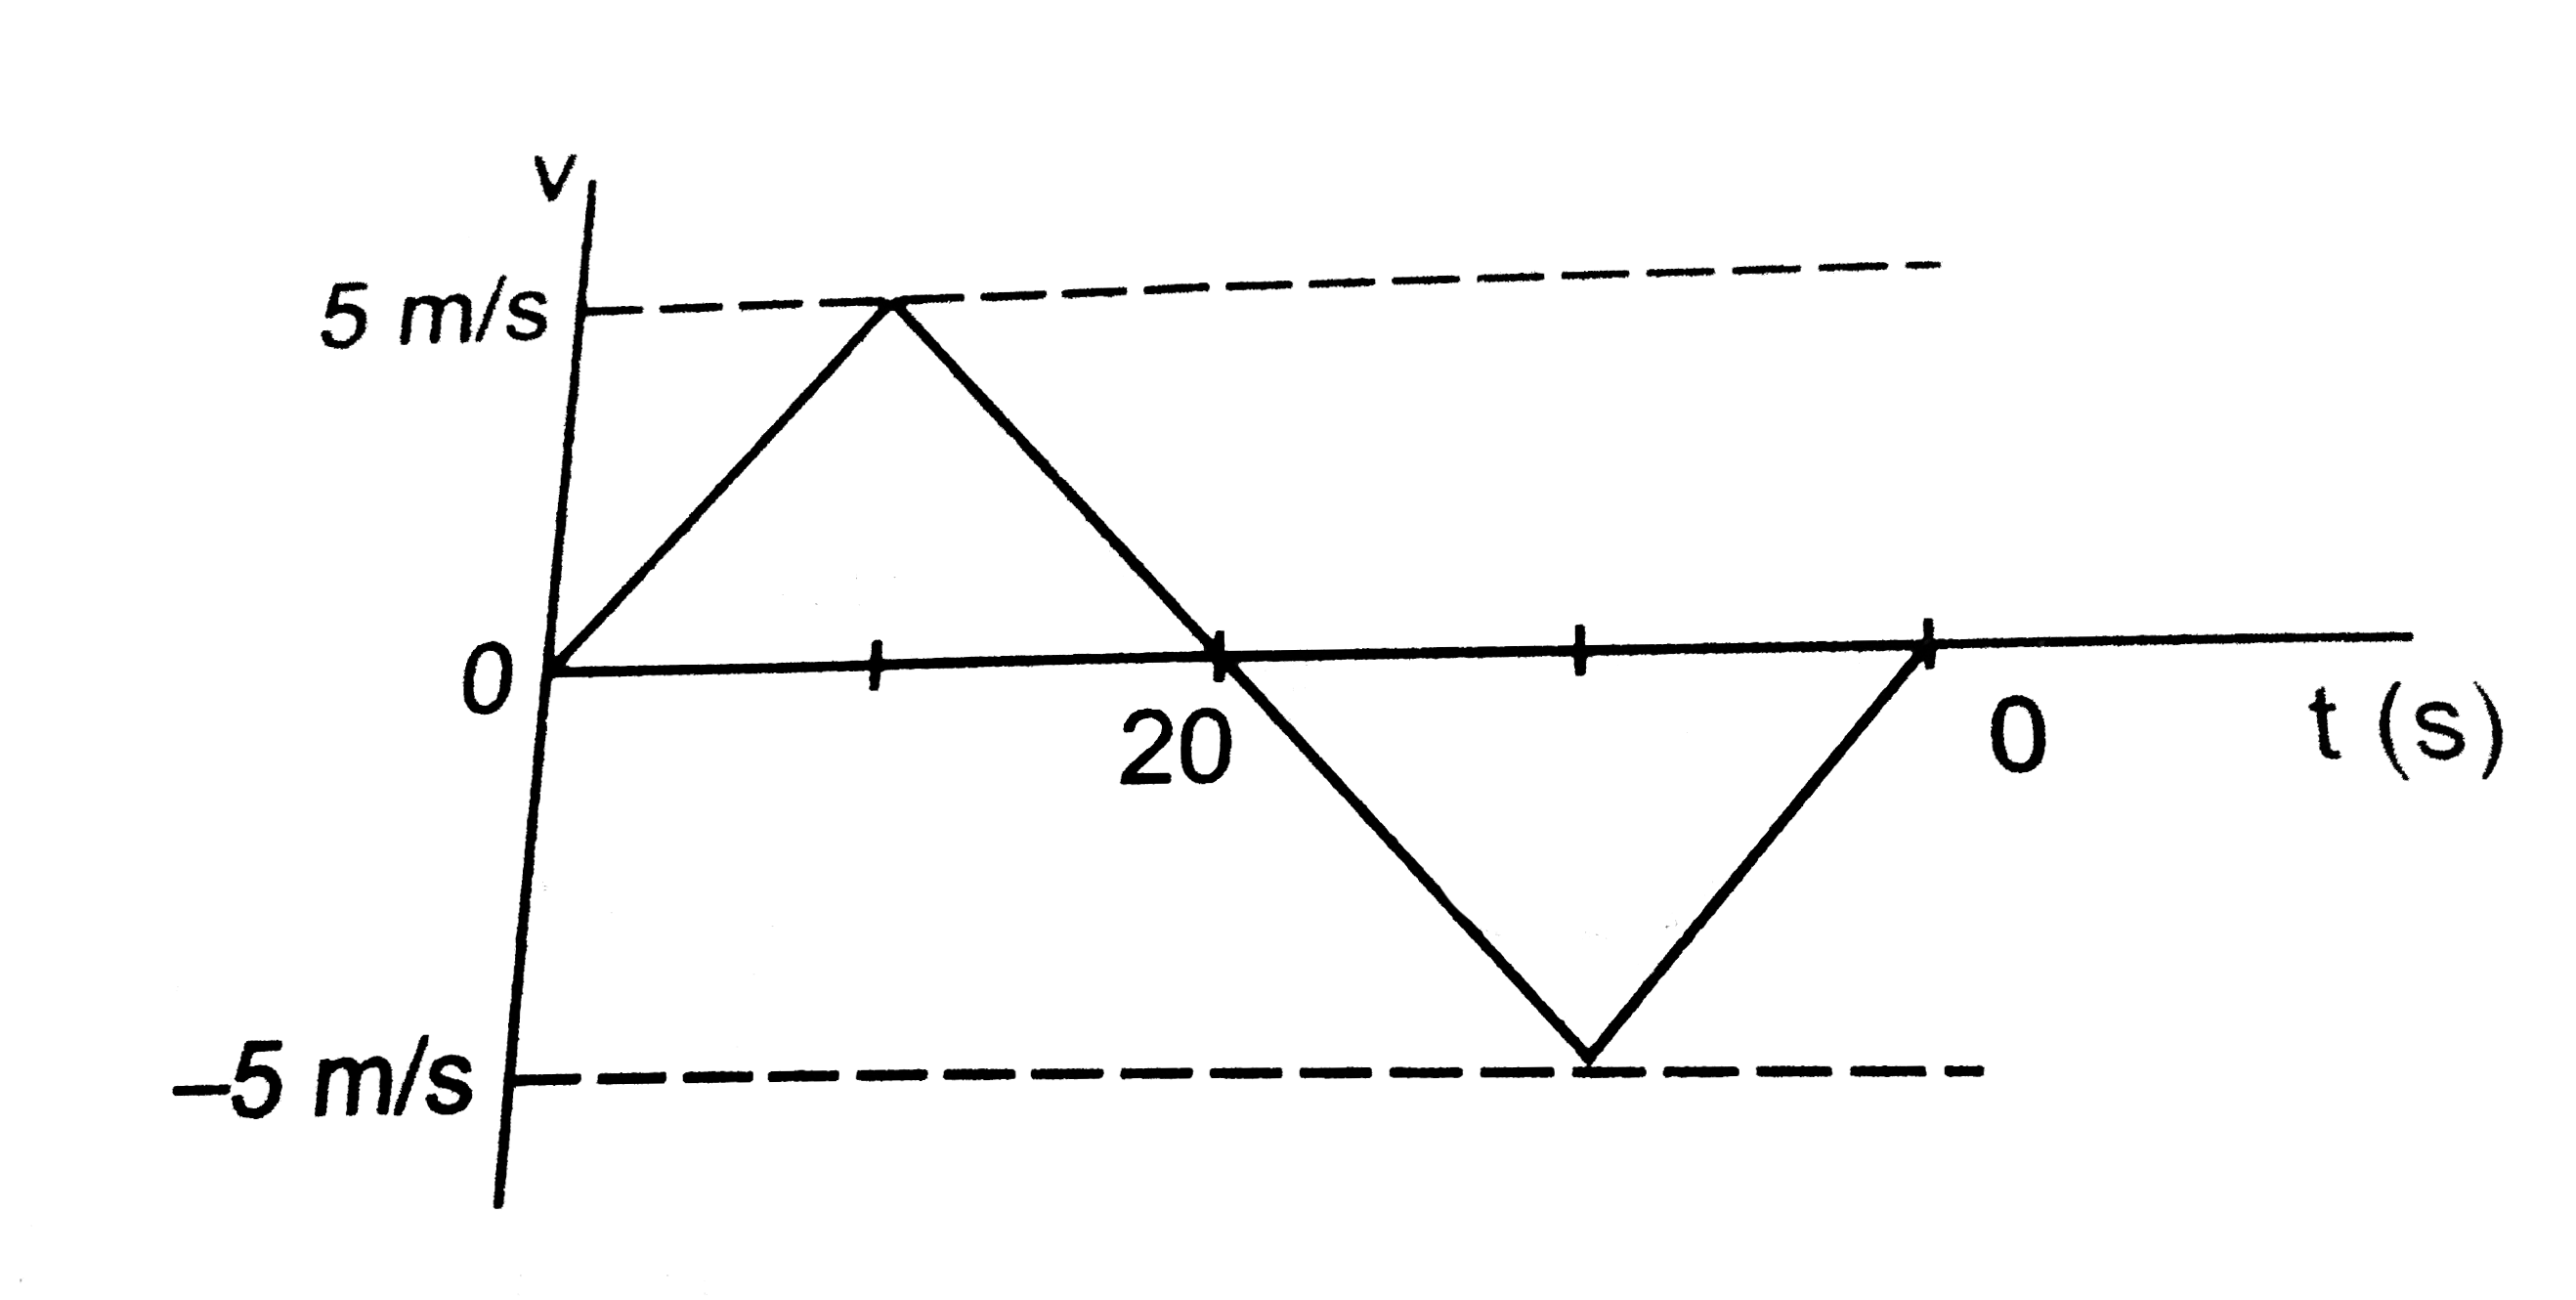
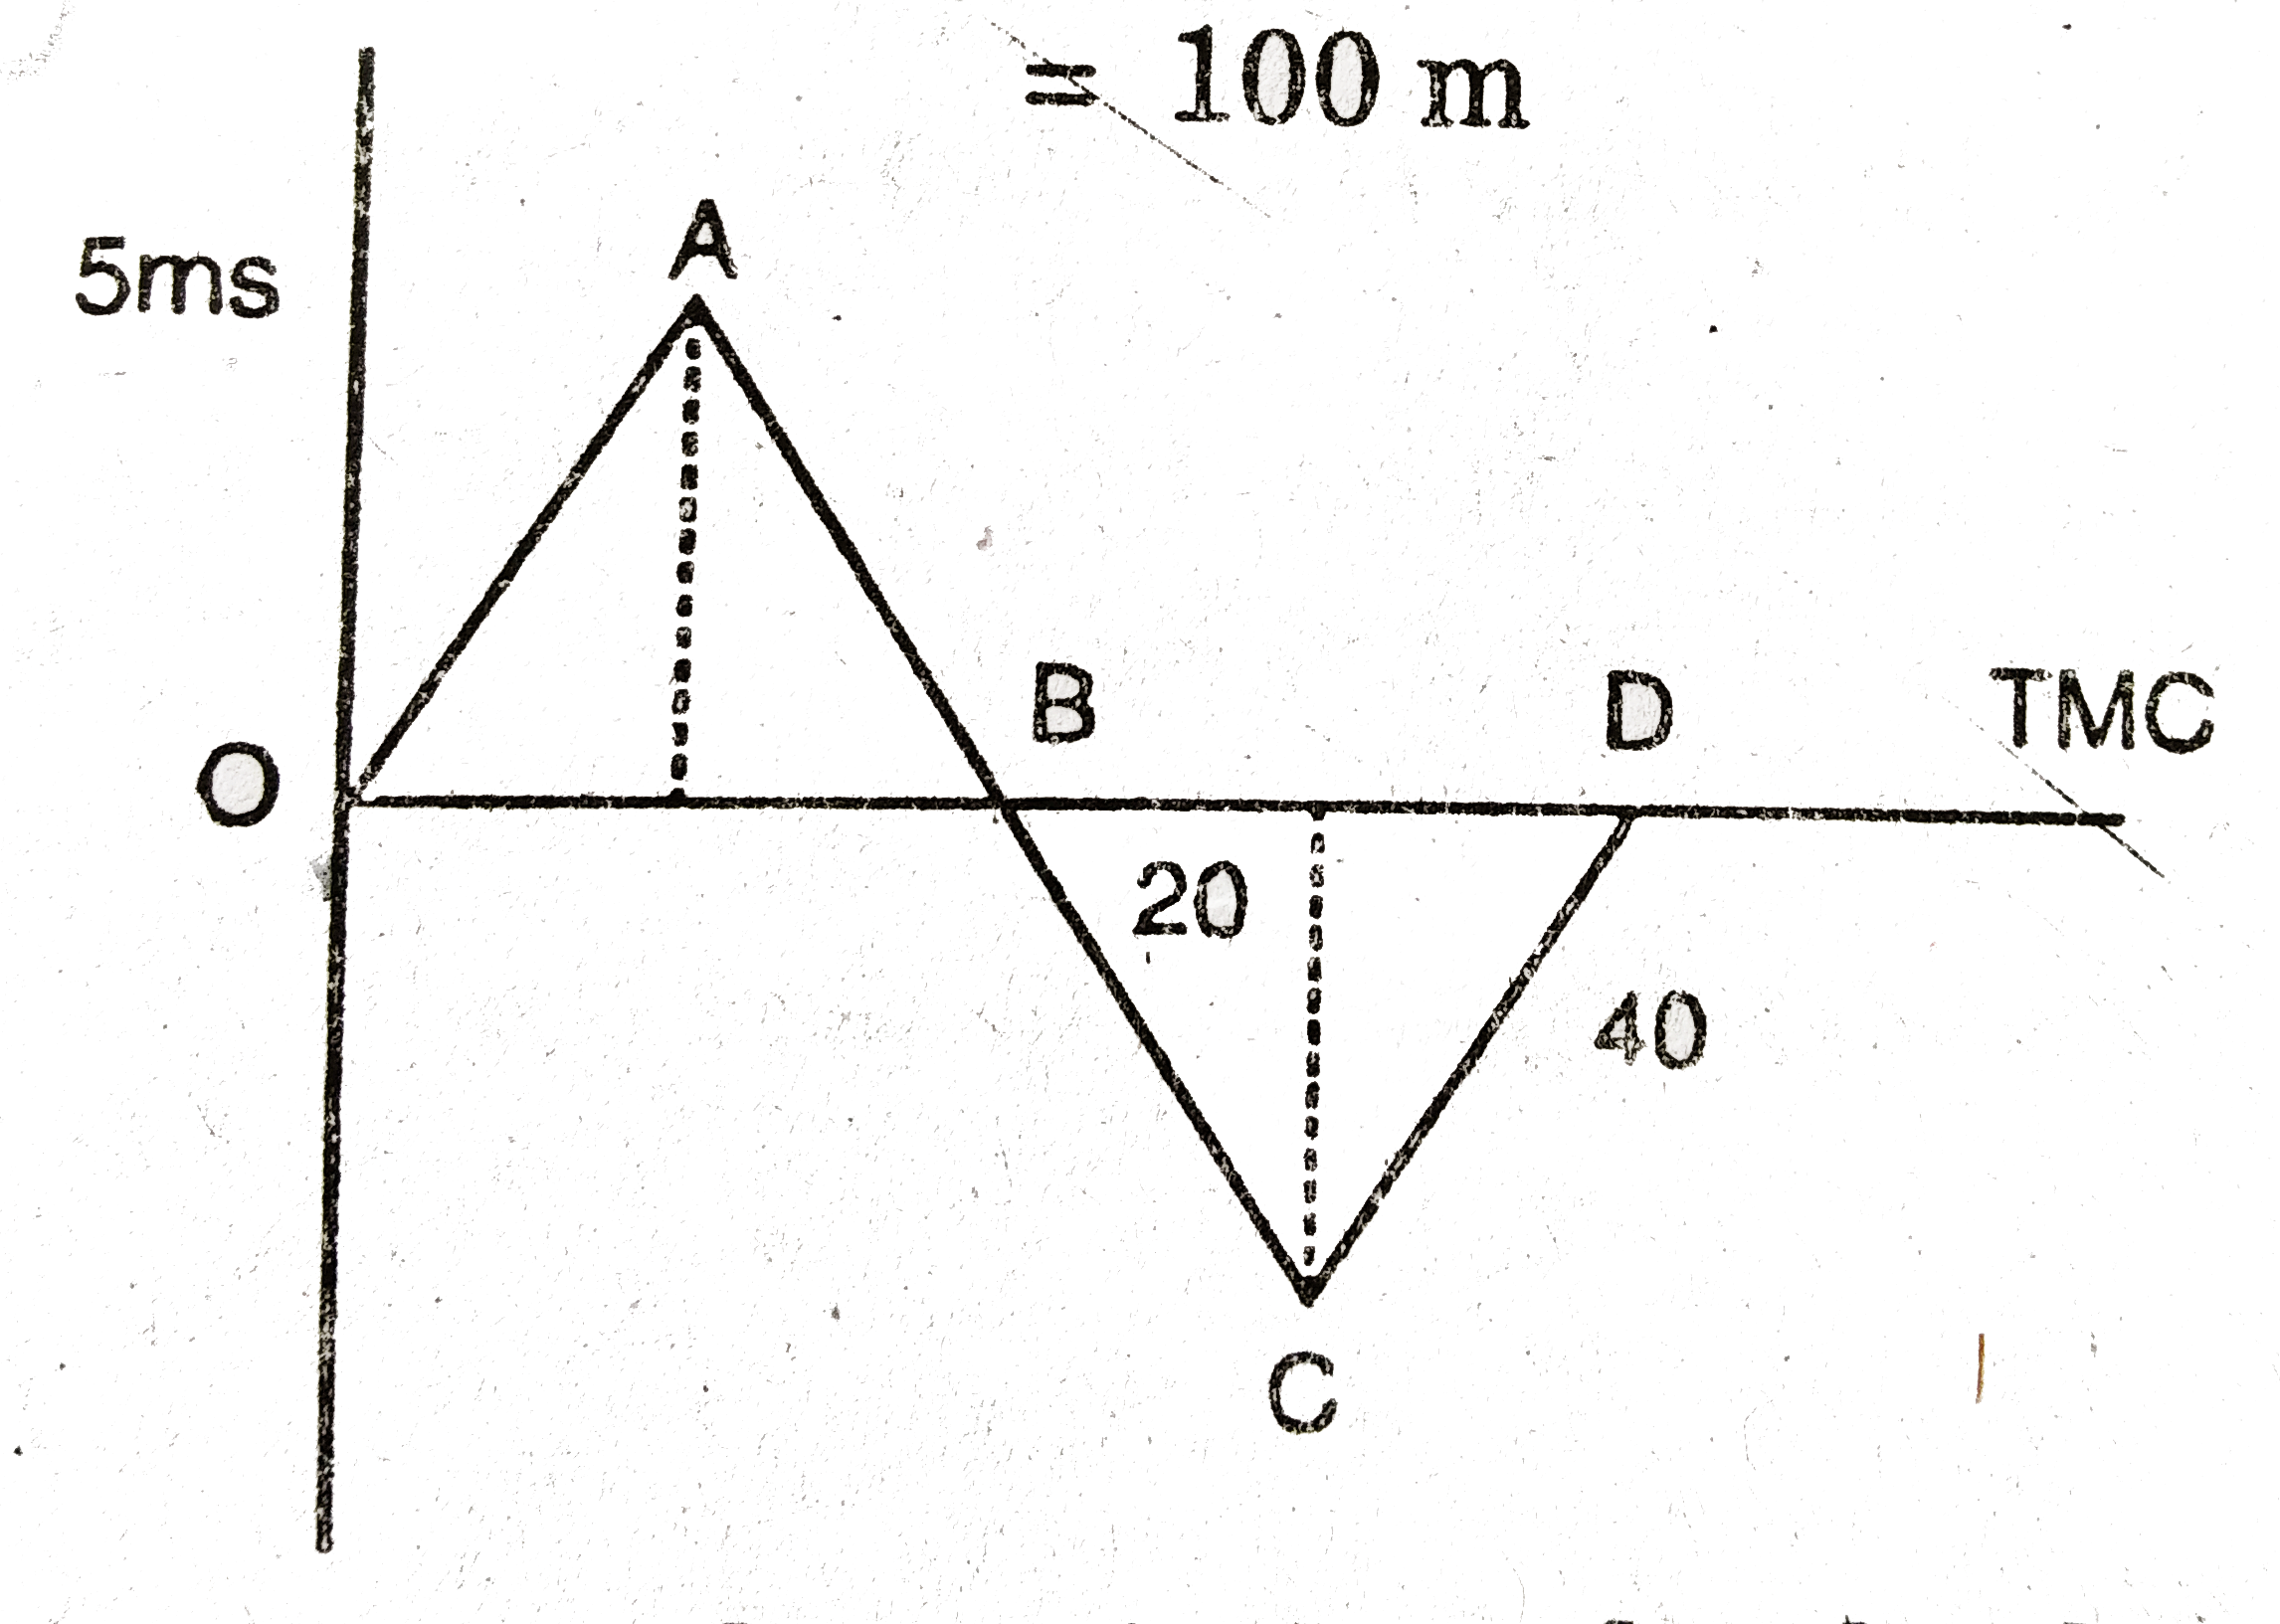
- From the velocity time plot shown in figure find the distance travelle...
Text Solution
|
- From the velocity time plot shown in figure find the distance travelle...
Text Solution
|
- A particle starting from rest moves with constant acceleration. If it ...
Text Solution
|
- From the velocity-time plot shown in Fig. find the distance travelled ...
Text Solution
|
- The velocity-time plot is shown in figure. Find the average speed in t...
Text Solution
|
- A point moves rectilinearly in on direction. Figure shows the distance...
Text Solution
|
- Figure-1.20 shows displacement-time graphof a particle. Find the time ...
Text Solution
|
- A particle moves in a straight line from origin. Its velocity time cur...
Text Solution
|
- संलग्न चित्र में प्रदर्शित किसी कण के वेग समय ग्राफ से ज्ञात कीजिए- ...
Text Solution
|