A
B
C
D
Text Solution
Verified by Experts
The correct Answer is:


Topper's Solved these Questions
Similar Questions
Explore conceptually related problems
HC VERMA-CAPACITORS-Objective 1
- A capacitor of capacitance C is charged to a potential V. The flux of ...
Text Solution
|
- Two capacitor each having capacitance Cand breakdown voltage Vare join...
Text Solution
|
- If the capacitors in the previous question are joined in parallel,the ...
Text Solution
|
- The equivalent capacitance of the combination show in figure is
Text Solution
|
- When a dielectric slab is gradually inserted between the plates of an ...
Text Solution
|
- The energy density in the electric field created by a point charge fal...
Text Solution
|
- A parallel-plate capacitor haas plates of unequal area . The large r p...
Text Solution
|
- A thin metal plate P is inserted between the plates of a parallel-plat...
Text Solution
|
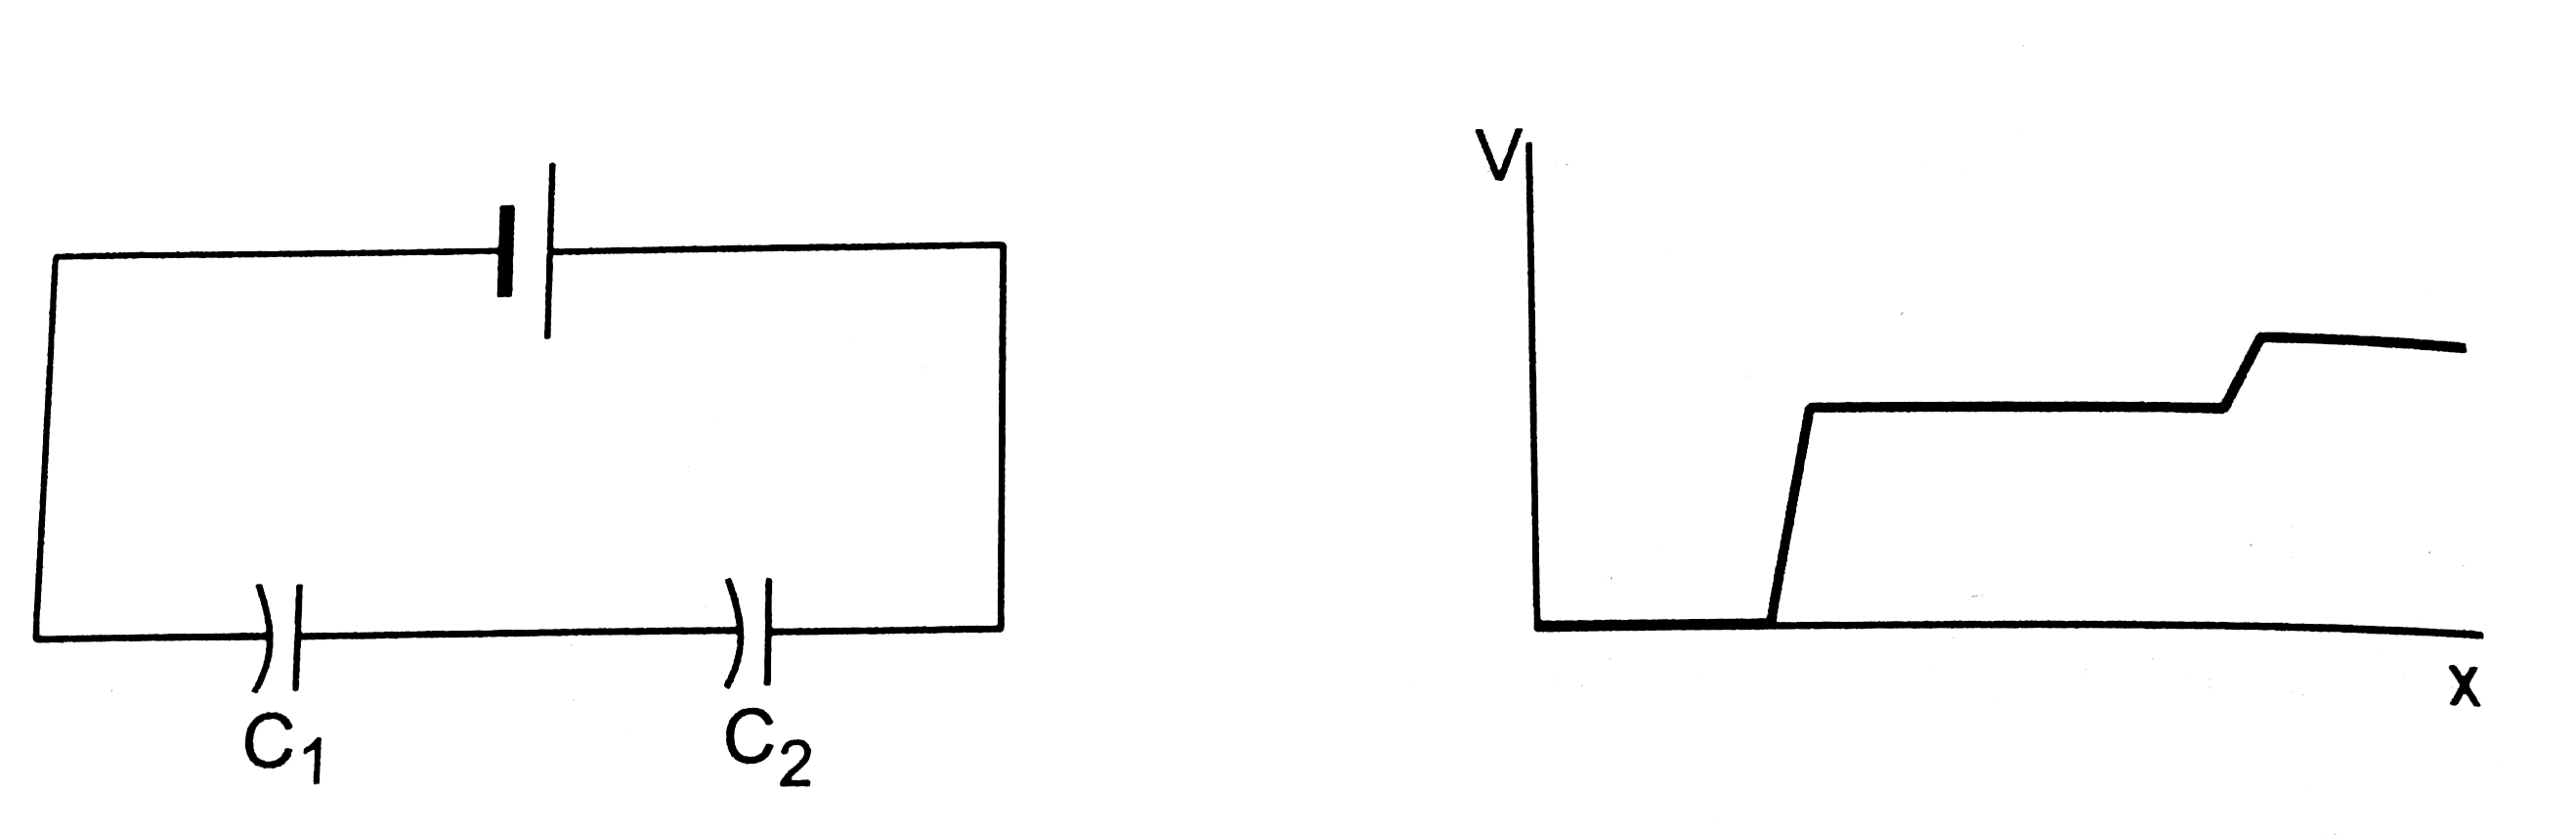
- Figure show two capacitors connected in series and joind to a bettery....
Text Solution
|
- Two metal plates having charges Q,-Q face each other at some separat...
Text Solution
|
- Two metal spheres of capacitances C1 and C2carry some charges . The...
Text Solution
|
- Three capacitors of capacitances 6mu F each are available.The minimum ...
Text Solution
|