Text Solution
Verified by Experts
The correct Answer is:


Topper's Solved these Questions
THERMAL AND CHEMICAL EFFECT OF ELECTRIC CURRENT
HC VERMA|Exercise Objective 2|5 VideosTHERMAL AND CHEMICAL EFFECT OF ELECTRIC CURRENT
HC VERMA|Exercise Exercises|24 VideosTHERMAL AND CHEMICAL EFFECT OF ELECTRIC CURRENT
HC VERMA|Exercise Short Answer|9 VideosTHE SPECIAL THEORY OF RELATIVITY
HC VERMA|Exercise Exercises|27 VideosX-Rays
HC VERMA|Exercise Exercises|27 Videos
Similar Questions
Explore conceptually related problems
HC VERMA-THERMAL AND CHEMICAL EFFECT OF ELECTRIC CURRENT-Objective 1
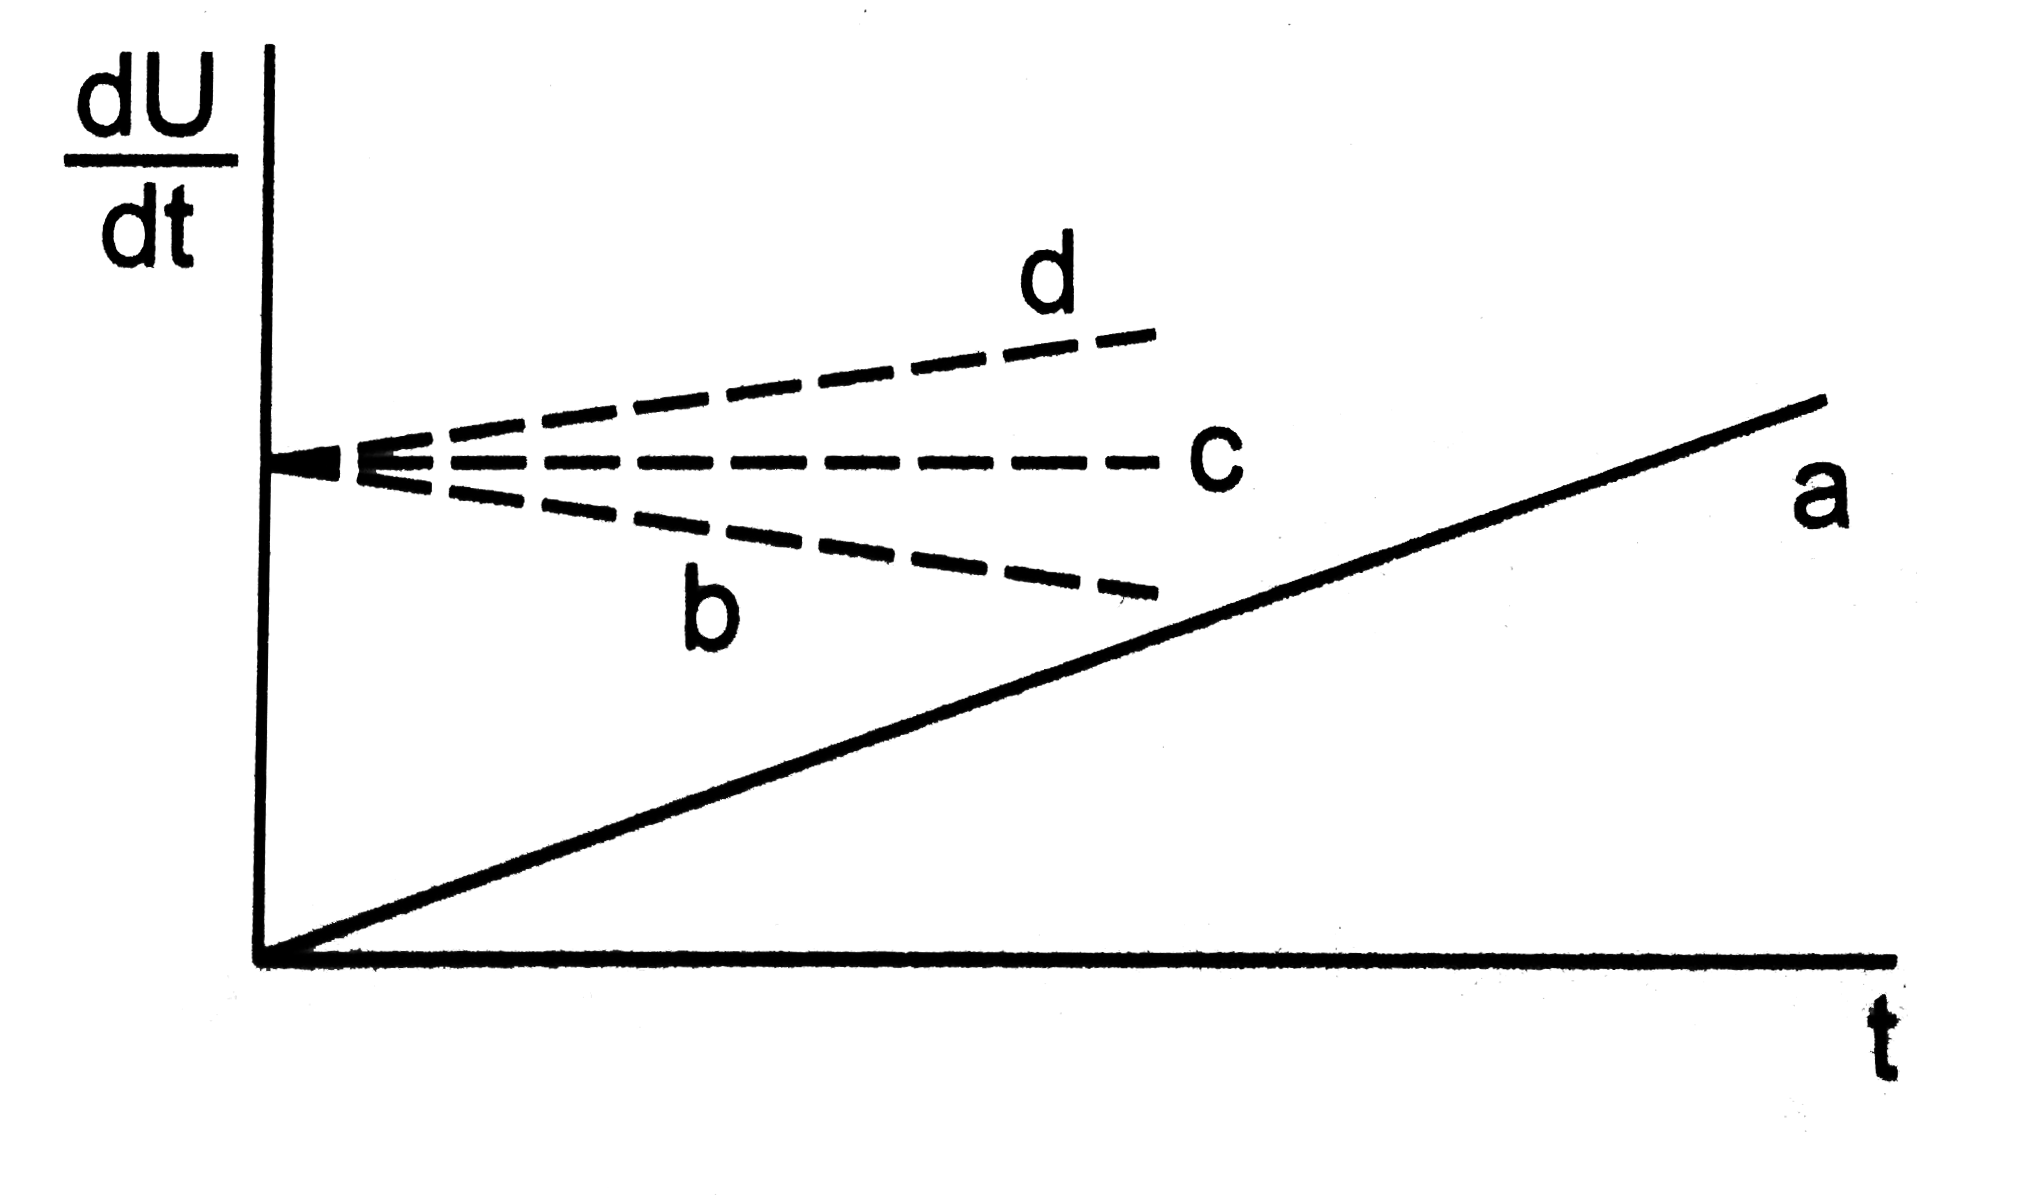
- Which of the following plotes may represent the thermal energy produce...
Text Solution
|
- A constant current i is passed through a resistor. Taking the temperat...
Text Solution
|
- Consider the following statements regarding a thermocouple. (A) The ne...
Text Solution
|
- The heat developed in a system is proportional to the current through ...
Text Solution
|
- Consider the following two statements (A) Free-electron density is dif...
Text Solution
|
- Consider the statements A and B in the previous queston. Peltier effec...
Text Solution
|
- Consider the statement A and B in question 5. Thomson effect is caused
Text Solution
|
- Faraday constant
Text Solution
|