A
B
C
D
Text Solution
Verified by Experts
The correct Answer is:


Topper's Solved these Questions
Similar Questions
Explore conceptually related problems
HC VERMA-X-Rays-Objective 1
- X-ray beam can be deflected
Text Solution
|
- Consider a photon of continuous X-ray coming from a Coolidge tube. Its...
Text Solution
|
- The energy of a photon of characteristic X-ray from a Coolidge tube co...
Text Solution
|
- If the potential difference applied to tube is doubled and the separat...
Text Solution
|
- If the current in the circuit for heating the filament is increased, t...
Text Solution
|
- Moseley's law for characteristic X-rays is sqrt v = a(Z-b). In this,
Text Solution
|
- Frequencies of Kalpha X-rays of different materials are measured. Whic...
Text Solution
|
- The X-ray beam coming from an X-ray tube
Text Solution
|
- One of the following wavelength is absent and the rest are present in ...
Text Solution
|
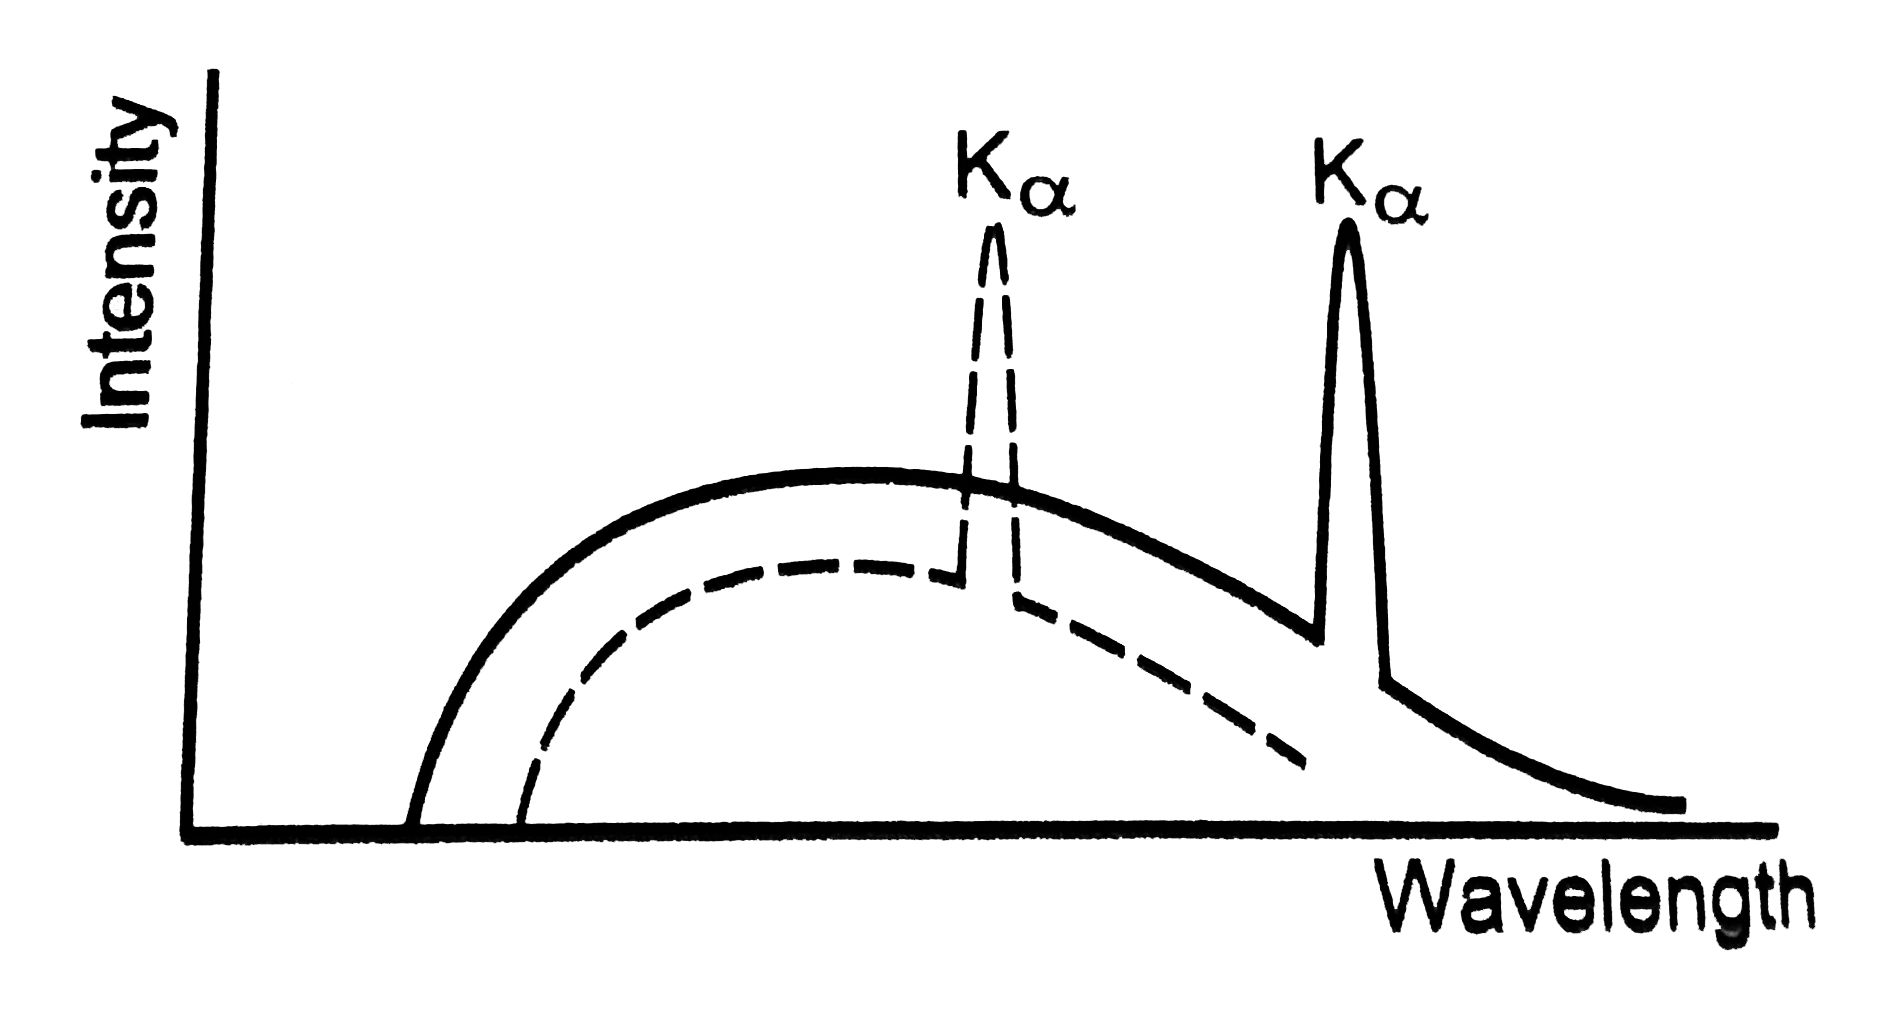
- Figure shows the intensity-wavelength relations of X-rays coming from ...
Text Solution
|
- 50% of the X-ray coming from a Coolidge tube is able to pase through a...
Text Solution
|
- 50% of the X-ray coming from a Cooling tube is able to pass through a ...
Text Solution
|
- X-ray from a Coolidge tube is incident on a thin aluminium foil. The i...
Text Solution
|
- Visible light passing through a circular hole forms a diffraction disc...
Text Solution
|