A
B
C
D
Text Solution
Verified by Experts
The correct Answer is:


Topper's Solved these Questions
Similar Questions
Explore conceptually related problems
NTA MOCK TESTS-NTA TPC JEE MAIN TEST 50-PHYSICS
- A long solenoid has 100 turns/ meter and a current of 3.5A is flowing ...
Text Solution
|
- The surface tension of a thin liquid film formed between a U shaped wi...
Text Solution
|
- Two equi convex lenses of focal lengths 20 cm and 30 cm respectively a...
Text Solution
|
- An equilateral prism produces an angle of deviation 60^(@) when the a...
Text Solution
|
- For identical rods each of mass m and length l make a square frame in ...
Text Solution
|
- A rod AB of mass m and length l is rotating about a vertical axis as s...
Text Solution
|
- A monoatomic gas expands following as thermodynamic law P=C(1)V+C(2), ...
Text Solution
|
- In Young's experiment when sodium light of wavelength 5893Å is used, t...
Text Solution
|
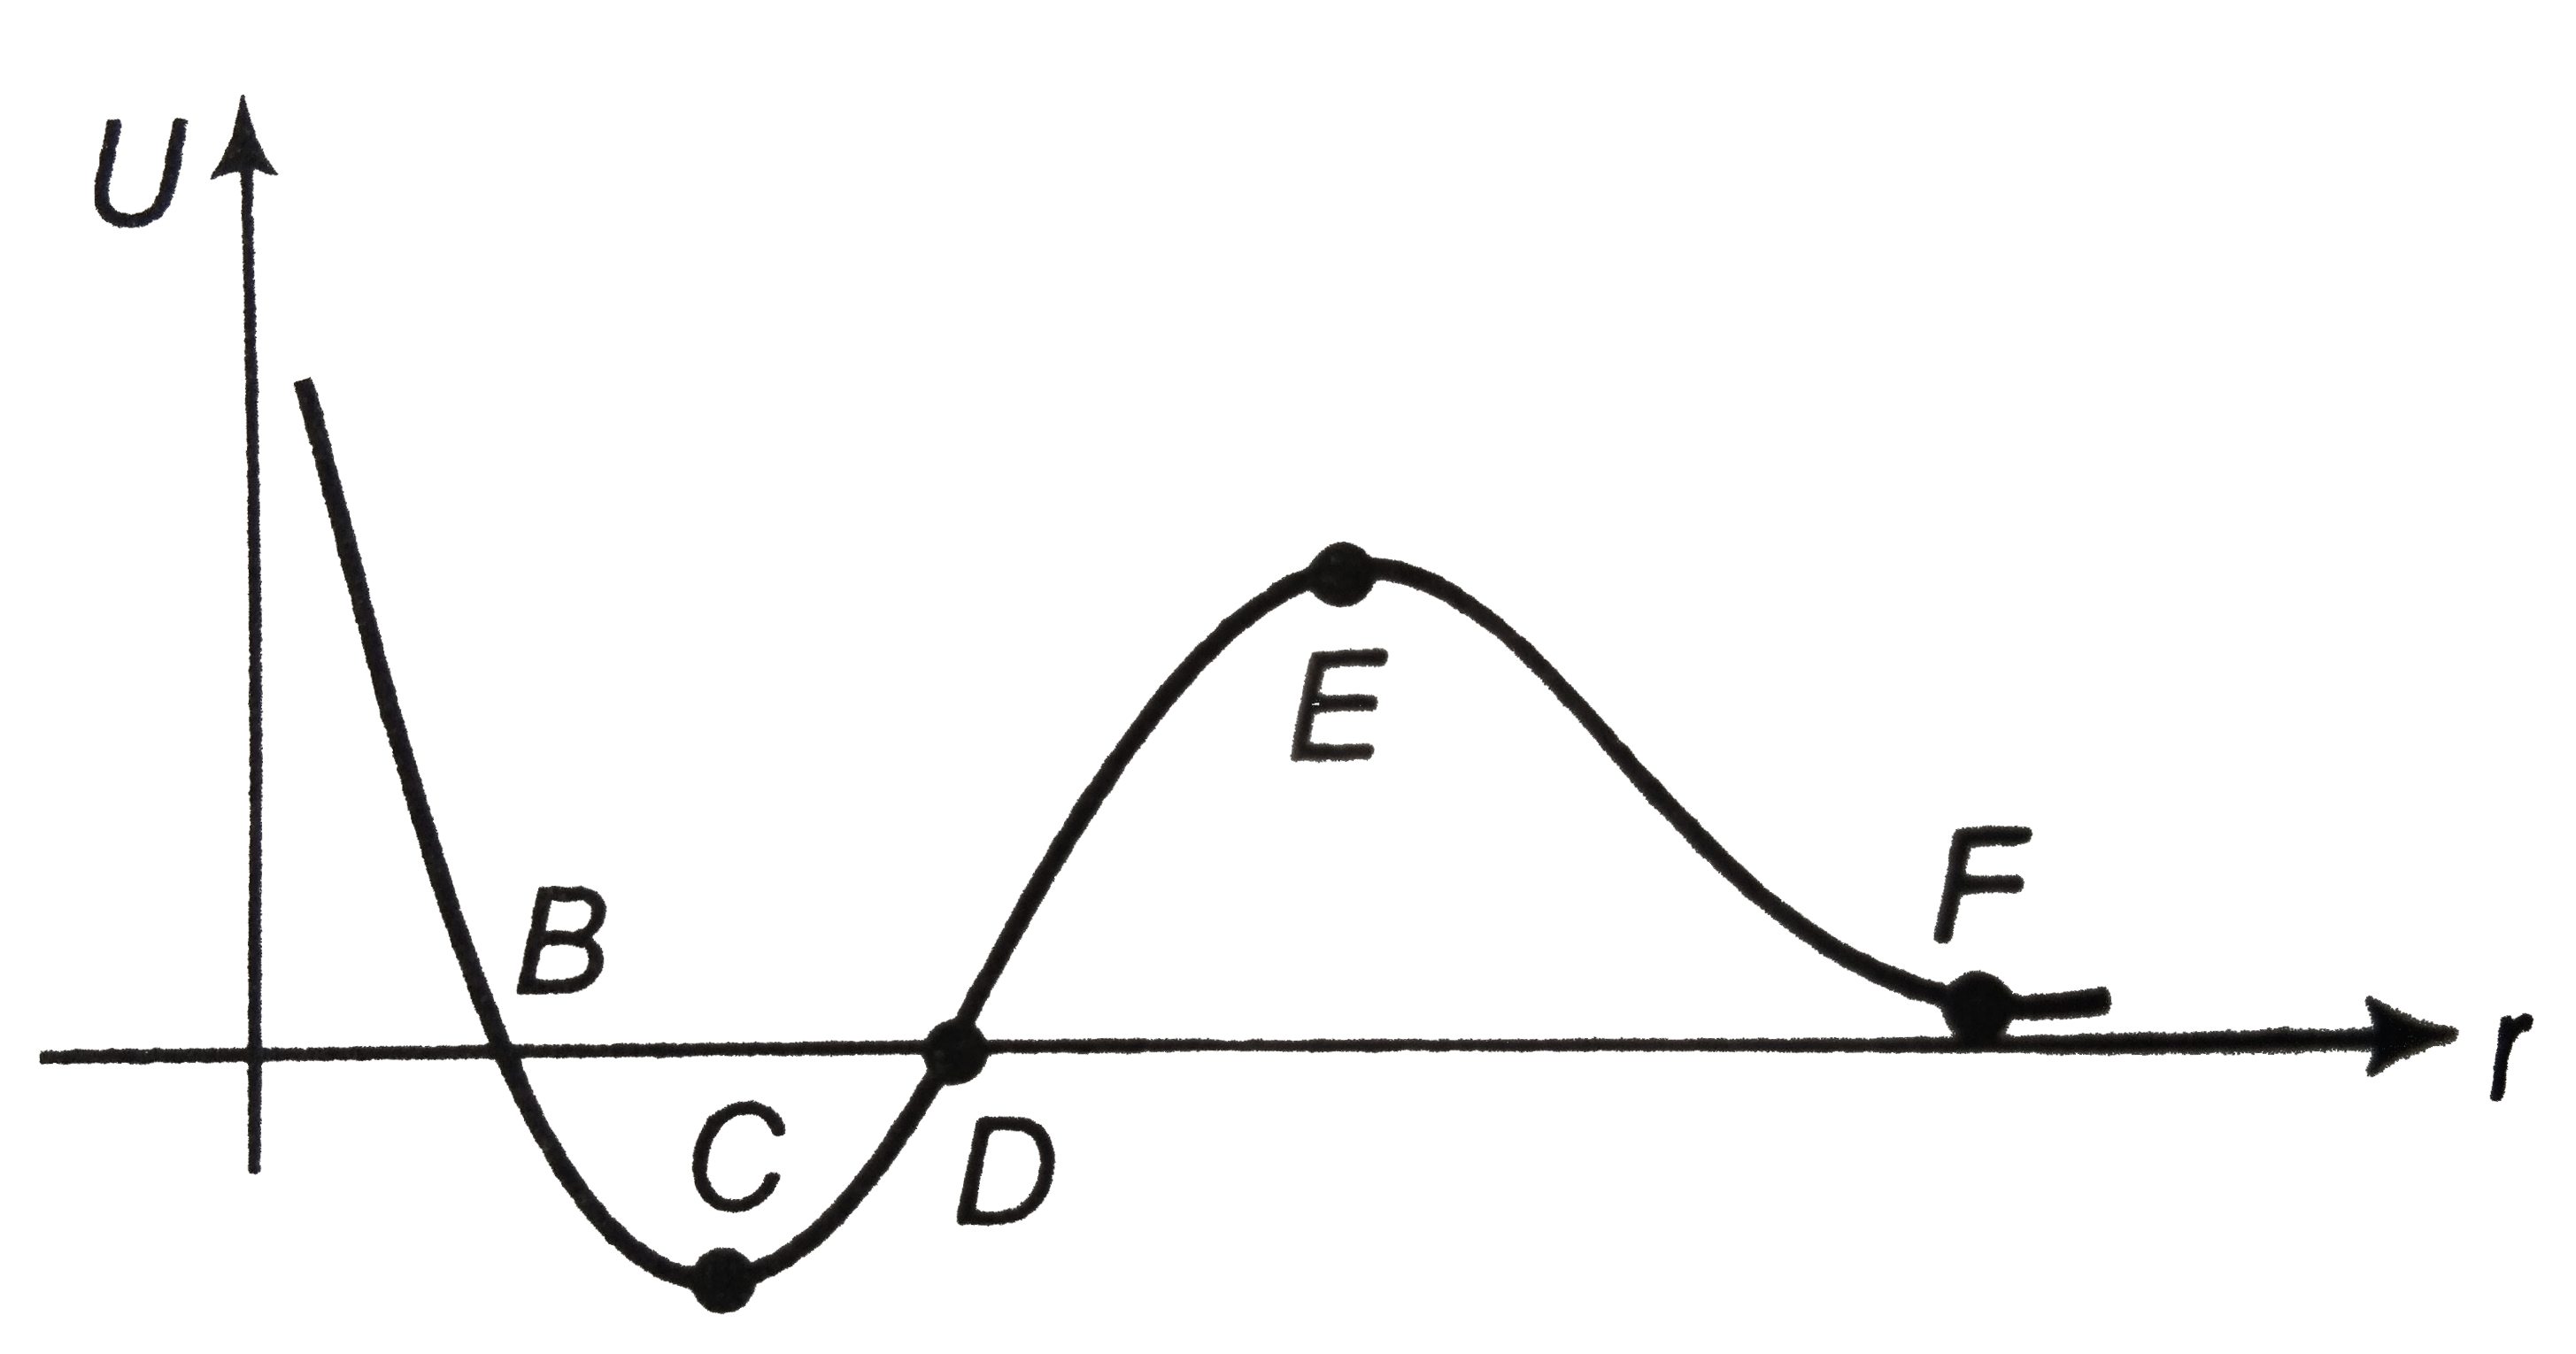
- The given plot shows the variation of U, the potential energy of inter...
Text Solution
|
- A baseball having a mass of 0.4 kg is thrown such that the force actin...
Text Solution
|
- Molecules of hydrogen and helium are kept at temperature 27^(@)C and 3...
Text Solution
|
- Calculate the ratio of current I(1) to current I(2) as depicted in the...
Text Solution
|
- Two identical glass bulbs, connected by a thin glass tube, are filled ...
Text Solution
|
- A long straight wire carrying current of 20A rests on a table (as show...
Text Solution
|
- If the wavelength of incident light on a soap film is 700 nm then its ...
Text Solution
|
- A bob of densit sigma=12gm^(-3) is suspended with a massless string of...
Text Solution
|
- What is the possible error (in%) in surface tension? If the following ...
Text Solution
|
- Consider a 1m long steel wire with the cross section of 0.05cm^(2) and...
Text Solution
|
- A metal sphere 10.01 cm in diameter is placed on a brass ring of inter...
Text Solution
|
- During an adiabatic expansion of one mole monoatomic gas its volume be...
Text Solution
|