A
B
C
D
Text Solution
Verified by Experts
The correct Answer is:


Similar Questions
Explore conceptually related problems
Recommended Questions
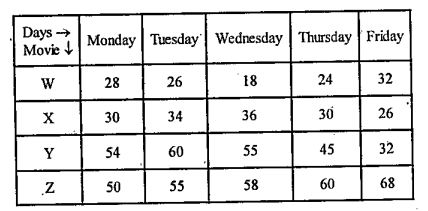
- This table shows the number of people who watched 4 different movies(W...
Text Solution
|
- Four different movies are running in a town. Ten students go to watch ...
Text Solution
|
- Match the following Column A to Column B
Text Solution
|
- Seven girls P,Q,R,S,T,U and V are watching movies on different days of...
Text Solution
|
- Seven girls P,Q,R,S,T,U and V are watching movies on different days of...
Text Solution
|
- Seven girls P,Q,R,S,T,U and V are watching movies on different days of...
Text Solution
|
- Seven girls P,Q,R,S,T,U and V are watching movies on different days of...
Text Solution
|
- Seven girls P,Q,R,S,T,U and V are watching movies on different days of...
Text Solution
|
- Seven persons P, Q, R, S, T, U and V watched movies on different days ...
Text Solution
|