


UPKAR PUBLICATION -DATA ANALYSIS-QUESTION BANK
- Examine the following graph carefully and answer the questions given b...
Text Solution
|
- Examine the following graph carefully and answer the questions given b...
Text Solution
|
- Examine the following graph carefully and answer the questions given b...
Text Solution
|
- Examine the following graph carefully and answer the questions given b...
Text Solution
|
- Examine the following graph carefully and answer the questions given b...
Text Solution
|
- Study the following graph carefully and answer the questions given bel...
Text Solution
|
- Study the following graph carefully and answer the questions given bel...
Text Solution
|
- Study the following graph carefully and answer the questions given bel...
Text Solution
|
- Study the following graph carefully and answer the questions given bel...
Text Solution
|
- Study the following graph carefully and answer the questions given bel...
Text Solution
|
- Given below is a bar diagram showing the percentage of Hindus, Sikhs a...
Text Solution
|
- Given below is a bar diagram showing the percentage of Hindus, Sikhs a...
Text Solution
|
- Given below is a bar diagram showing the percentage of Hindus, Sikhs a...
Text Solution
|
- Given below is a bar diagram showing the percentage of Hindus, Sikhs a...
Text Solution
|
- Given below is a bar diagram showing the percentage of Hindus, Sikhs a...
Text Solution
|
- Given below is a bar diagram showing the percentage of Hindus, Sikhs a...
Text Solution
|
- Given below is a bar diagram showing the percentage of Hindus, Sikhs a...
Text Solution
|
- Given below is a bar diagram showing the percentage of Hindus, Sikhs a...
Text Solution
|
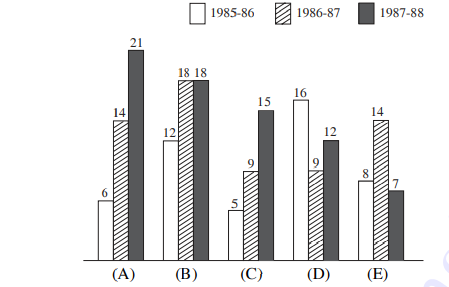
- Glven here is a multiple bar diagram depicting the changes in the stud...
Text Solution
|
- Shown below is the multiple bar diagram depicting the changes in the s...
Text Solution
|