


UPKAR PUBLICATION -DATA ANALYSIS-QUESTION BANK
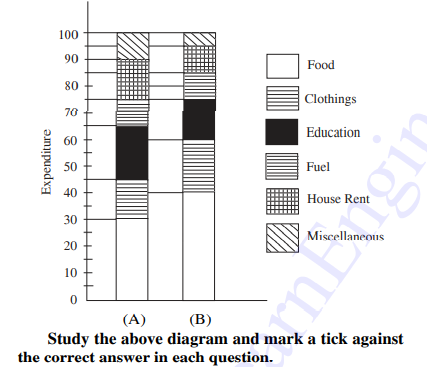
- Following bar diagram shows the monthly expenditure of two families on...
Text Solution
|
- Following bar diagram shows the monthly expenditure of two families on...
Text Solution
|
- Following bar diagram shows the monthly expenditure of two families on...
Text Solution
|
- Following bar diagram shows the monthly expenditure of two families on...
Text Solution
|
- The sum-divided bar-diagram given below depicts the result of B.Sc. St...
Text Solution
|
- The sum-divided bar-diagram given below depicts the result of B.Sc. St...
Text Solution
|
- The sum-divided bar-diagram given below depicts the result of B.Sc. St...
Text Solution
|
- The sum-divided bar-diagram given below depicts the result of B.Sc. St...
Text Solution
|
- The sum-divided bar-diagram given below depicts the result of B.Sc. St...
Text Solution
|
- The sum-divided bar-diagram given below depicts the result of B.Sc. St...
Text Solution
|
- The following graph shows the temperature of a patient observed in a h...
Text Solution
|
- The following graph shows the temperature of a patient observed in a h...
Text Solution
|
- The following graph shows the temperature of a patient observed in a h...
Text Solution
|
- The following graph shows the temperature of a patient observed in a h...
Text Solution
|
- The following graph shows the temperature of a patient observed in a h...
Text Solution
|
- The following graph shows the annual premium of an insurance company. ...
Text Solution
|
- The following graph shows the annual premium of an insurance company. ...
Text Solution
|
- The following graph shows the annual premium of an insurance company. ...
Text Solution
|
- The following graph shows the annual premium of an insurance company. ...
Text Solution
|
- The following graph shows the annual premium of an insurance company. ...
Text Solution
|