A
B
C
D
Text Solution
Verified by Experts
The correct Answer is:


Topper's Solved these Questions
Similar Questions
Explore conceptually related problems
UPKAR PUBLICATION -TABULATION-QUESTION BANK
- Study the following table carefully and answer the question given belo...
Text Solution
|
- Study the following table carefully and answer the question given belo...
Text Solution
|
- Study the following table carefully and answer the question given belo...
Text Solution
|
- Study the following table carefully and answer the question given belo...
Text Solution
|
- Study the following table carefully and answer the question given belo...
Text Solution
|
- Study the following table carefully and answer the question given belo...
Text Solution
|
- Study the following table carefully and answer the question given belo...
Text Solution
|
- Study the following table carefully and answer the question given belo...
Text Solution
|
- Study the following table carefully and answer the question given belo...
Text Solution
|
- Study the following table carefully and answer the question given belo...
Text Solution
|
- Study the following table carefully and answer the question given belo...
Text Solution
|
- Study the following table carefully and answer the question given belo...
Text Solution
|
- Study the following table carefully and answer the question given belo...
Text Solution
|
- Study the following table carefully and answer the question given belo...
Text Solution
|
- Study the following table carefully and answer the question given belo...
Text Solution
|
- Study the following table carefully and answer the question given belo...
Text Solution
|
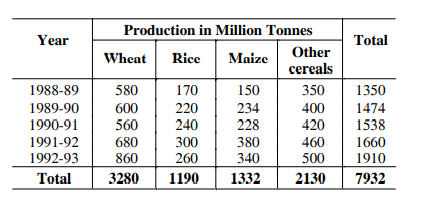
- The following table shows the production of foodgrains in million tonn...
Text Solution
|
- The following table shows the production of foodgrains in million tonn...
Text Solution
|
- The following table shows the production of foodgrains in million tonn...
Text Solution
|
- The following table shows the production of foodgrains in million tonn...
Text Solution
|