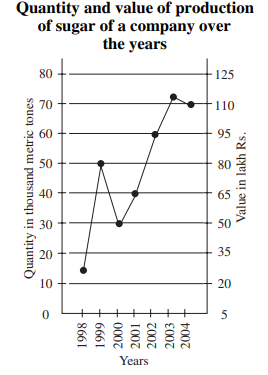
A
B
C
D
Text Solution
Verified by Experts
The correct Answer is:
Topper's Solved these Questions
Similar Questions
Explore conceptually related problems
UPKAR PUBLICATION -MISCELLANEOUS EXERCISE -I-QUESTION BANK
- Study the following graph carefully and answer the questions given bel...
Text Solution
|
- Study the following graph carefully and answer the questions given bel...
Text Solution
|
- Study the following graph carefully and answer the questions given bel...
Text Solution
|
- Study the following graph carefully and answer the questions given bel...
Text Solution
|
- 7 men, 5 women and 8 children were given n assignment of distributi...
Text Solution
|
- The present ages of A, B, and C are in the ratio of 8:14:22 respect...
Text Solution
|
- Mohan distributed his total assets to his wife three sons, two daughte...
Text Solution
|
- In a one-day cricket match the captain of one of the teams scored 3...
Text Solution
|
- The radius of a circle is 20% more than the height of a right-angle...
Text Solution
|
- Two-third of one-fourth of a number is equal to 40% of another number....
Text Solution
|
- A shopkeeper bought three varieties A, B and cC of rice in differen...
Text Solution
|
- When an odd number of two digit is divided by an even number of two di...
Text Solution
|
- The area of a square of one side 8 cm is equal to the area of a rectan...
Text Solution
|
- Study the following graph carefully and answer the question given belo...
Text Solution
|
- Study the following graph carefully and answer the question given belo...
Text Solution
|
- Study the following graph carefully and answer the question given belo...
Text Solution
|
- Study the following graph carefully and answer the question given belo...
Text Solution
|
- Study the following graph carefully and answer the question given belo...
Text Solution
|
- In each of the following questions a number series is given followed b...
Text Solution
|
- In each of the following questions a number series is given followed b...
Text Solution
|
