Home
Class 14
MATHS
Study the following graph to answer the ...

Study the following graph to answer the given questions.
Per cent profit earned by two companies over the given years

If the income of Company X in 1998 – 99 was equal to the expenditure of Company Y in 2001 – 02. What was the ratio of their respective profits?

A

`13:15`

B

`15:26`

C

`13:26`

D

Cannot be determined

Text Solution

Verified by Experts

The correct Answer is:
D
Promotional Banner

Topper's Solved these Questions

  • MISCELLANEOUS EXERCISE - III

    UPKAR PUBLICATION |Exercise QUESTION BANK|78 Videos
  • MISCELLANEOUS EXERCISE -II

    UPKAR PUBLICATION |Exercise QUESTION BANK |88 Videos

Similar Questions

Explore conceptually related problems

Study the following graph carefully and answer the given questions :- The following graph shows the % profit of two companies over the years :- If the total income of company B in 2011 was Rs 200 lakhs what was the expenditure of company A in the same year ?

Study the following graph carefully and answer the given questions :- The following graph shows the % profit of two companies over the years :- If the total expenditure of company A in 2007 was Rs 150 lakhs what was the total income ?

Study the following graph carefully and answer the given questions :- The following graph shows the % profit of two companies over the years :- If income of company A in the year 2006 and 2009 are same then what is the respective ratio of expenditure of company A in both the same years ?

Study the following graph carefully to answer the question that follow What is the average percent profit earned by company B over all the years together in (approx) ?

Study the following graph carefully and answer the given questions :- The following graph shows the % profit of two companies over the years :- In which of the following years the ratio of expenditure to income was the least for company B?

Study the following graph carefully to answer the questions that follows In the given years total earned profit by two companies "% profit"="Income-Expenditure"/"Expenditure"xx100% If the income of company Ain 2006-07 was equal to expenditure of company B in 2010-11 then what was the respective ratio of income of company A in 2006-07 and that of company B in 2010-11 ?

UPKAR PUBLICATION -MISCELLANEOUS EXERCISE -I-QUESTION BANK
  1. Present ages of Seema and Naresh are in the respective ratio of 5: 7. ...

    Text Solution

    |

  2. For the two given questions I and II 6p^2 + 5p + 1 = 0 20q^2 + 9q ...

    Text Solution

    |

  3. For the two given questions I and II 3p^2+ 2p – 1 = 0 2q^2 + 7q + ...

    Text Solution

    |

  4. For the two given questions I and II 3p^2 - 15p-18 = 0 q^2 + 7q + ...

    Text Solution

    |

  5. For the two given questions I and II p = sqrt 4/ sqrt 9 9q^2 – 12q...

    Text Solution

    |

  6. For the two given questions I and II 3p^2 + 15p-18 = 0 q^2 + 7q + ...

    Text Solution

    |

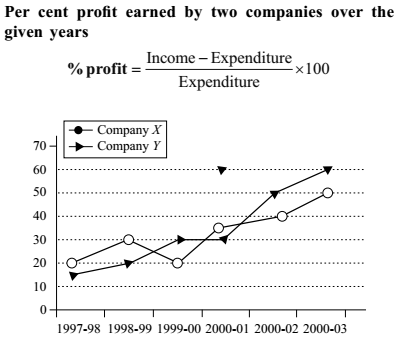
  7. Study the following graph carefully and answer the questions given bel...

    Text Solution

    |

  8. Study the following graph carefully and anser the question If the inc...

    Text Solution

    |

  9. Mr. Ramesh opened a workshop investing Rs. 40,000. He invested additio...

    Text Solution

    |

  10. The average (Arithmetic Mean) and the Median of a set of numbers is th...

    Text Solution

    |

  11. Study the following table carefully to answer these questions Percen...

    Text Solution

    |

  12. Study the following table carefully to answer these questions Percen...

    Text Solution

    |

  13. Study the following table carefully to answer these questions Percen...

    Text Solution

    |

  14. Study the following table carefully to answer these questions Percen...

    Text Solution

    |

  15. Study the following table carefully to answer these questions Percen...

    Text Solution

    |

  16. Study the following graph to answer the given questions. Per cent pr...

    Text Solution

    |

  17. Study the following graph to answer the given questions. Per cent pr...

    Text Solution

    |

  18. Study the following graph to answer the given questions. Per cent pr...

    Text Solution

    |

  19. Study the following table to answer these questions Approximately ...

    Text Solution

    |

  20. Study the following table to answer these questions What is the av...

    Text Solution

    |