A
B
C
D
Text Solution
Verified by Experts
The correct Answer is:


Topper's Solved these Questions
Similar Questions
Explore conceptually related problems
GAGAN PRATAP -DATA INTERPRETATION (DI)-MULTIPLE CHOICE QUESTION
- The given table shows the number (in percent) of employees working in ...
Text Solution
|
- The given table shows the number (in percent) of employees working in ...
Text Solution
|
- The given table shows the number (in percent) of employees working in ...
Text Solution
|
- The table given below shows the production of maize by 5 different sta...
Text Solution
|
- The table given below shows the production of maize by 5 different sta...
Text Solution
|
- The table given below shows the production of maize by 5 different sta...
Text Solution
|
- The table given below shows the production of maize by 5 different sta...
Text Solution
|
- The table given below shows the production of maize by 5 different sta...
Text Solution
|
- Study the given graph and answer the question that follows If 20%...
Text Solution
|
- Study the given graph and answer the questopm the follows The num...
Text Solution
|
- Study the given graph and answer the question that follows Break up ...
Text Solution
|
- Study the given graph and answer the question that follows. By wh...
Text Solution
|
- Study the graph and answer the question that follows आरेख का अध्ययन ...
Text Solution
|
- Study the given graph and answer the question that follows. The t...
Text Solution
|
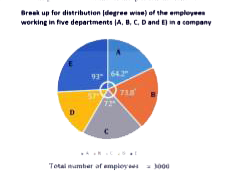
- Study the pie-chart and answer the questions: Break up (degree wise) o...
Text Solution
|
- Study the pie-chart and answer the options:- If the ratio of male...
Text Solution
|
- Study the following pie chart and table to answer the question Tot...
Text Solution
|
- Study the following pie- chart and table to answer the questions numbe...
Text Solution
|
- Study the following pie- chart and table to answer the questions numbe...
Text Solution
|
- Study the pie-chart and answer the questions: Break up (degree wise) o...
Text Solution
|