A
B
C
D
Text Solution
Verified by Experts
The correct Answer is:


Similar Questions
Explore conceptually related problems
Recommended Questions
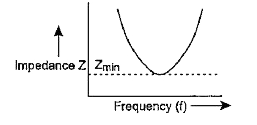
- A graph showing variation in impedance Z of a series LCR circuit, with...
Text Solution
|
- Which of the following curves represents the variation of impedence (Z...
Text Solution
|
- Sketch a graph showing the variation of impedance of LCR circuit the f...
Text Solution
|
- In the series LCR circuit shown the impedance is
Text Solution
|
- At resonance frequency the impedance in series LCR circuit is
Text Solution
|
- LCR श्रेणी अनुनादी परिपथ के लिए आरोपित आवृति (v) तथा प्रतिबाधा (Z) के ...
Text Solution
|
- Sketch graphs to show the variation of (i) current and (ii) impedance ...
Text Solution
|
- When the frequency of the ac voltage applied to a series LCR circuit i...
Text Solution
|
- What is impedance ? When does LCR circuit have minimum impedance?
Text Solution
|