A
B
C
D
Text Solution
Verified by Experts
The correct Answer is:


Similar Questions
Explore conceptually related problems
Recommended Questions
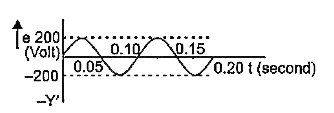
- Figure given below shows a graph of emf 'epsilon' generated by an ac g...
Text Solution
|
- If the area of the coil of an ac dynamo is halved, how would the emf g...
Text Solution
|
- How are the different emfs generated in a three-plane AC generator? Sh...
Text Solution
|
- Give the expression for maximum induced emf in an ac generator.
Text Solution
|
- The emf generated by an electrochemical cell is given by the symbol
Text Solution
|
- What is the instantaneous value of induced emf generated in the coil o...
Text Solution
|
- Discuss characteristic of induced emf in AC generator.
Text Solution
|
- Write equation of maximum emf in AC generator
Text Solution
|
- In AC generator, induced emf is zero at time t = 0. The induced emf at...
Text Solution
|