A
B
C
D
Text Solution
Verified by Experts
The correct Answer is:


Similar Questions
Explore conceptually related problems
Recommended Questions
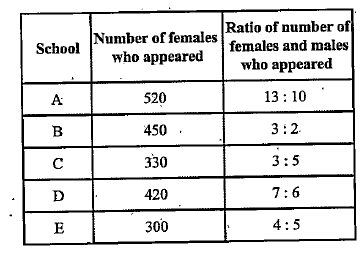
- Study the table and answer the given questions Data regarding number...
Text Solution
|
- In an examination the percentage of students qualified to the number o...
Text Solution
|
- Match the following Column A to Column B
Text Solution
|
- Study the given pie chart and answer the question that follows Th...
Text Solution
|
- Study the following pie-chart and then answer the given question. The ...
Text Solution
|
- Study the following pie-chart and then answer the given question. The ...
Text Solution
|
- Study the following pie-chart and then answer the given question. The ...
Text Solution
|
- Identify A,B,C and D,E <img src="https://d10lpgp6xz60nq.cloudfront.net...
Text Solution
|
- यदि a * b = a^2 - b^2 हो तो, [(4 * 3) + (7 * 5)] का मान क्या होगा?
Text Solution
|