A
B
C
D
Text Solution
Verified by Experts
The correct Answer is:


Similar Questions
Explore conceptually related problems
Recommended Questions
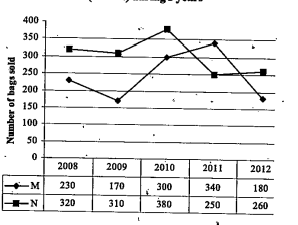
- Refer to the graph and answer the given questions. Data related to t...
Text Solution
|
- A cement company earns a profit of Rs 8 per bag of white cement sold ...
Text Solution
|
- How many bags of grain can be stored in a cuboidal granary (8mxx6mxx3...
Text Solution
|
- What is the ratio of the total bnumber of N and L type products togeth...
Text Solution
|
- What is the ratio of total books sold by store P and R together to th...
Text Solution
|
- Number of Redmi cellular sold by store R is what percent more than the...
Text Solution
|
- Number of L type product sold by store F is what percent of the number...
Text Solution
|
- What is the respective ratio of total number of N and L type products ...
Text Solution
|
- A cement company earns a profit of Rs 8 per bag of white cement sold ...
Text Solution
|