A
B
C
D
Text Solution
Verified by Experts
The correct Answer is:


Similar Questions
Explore conceptually related problems
Recommended Questions
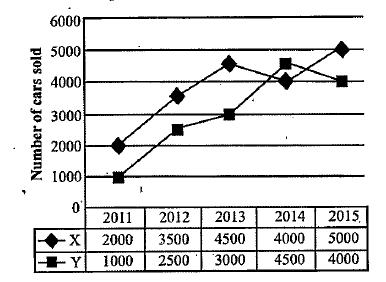
- Read the following line graph answer the following questions There are...
Text Solution
|
- There are two car manufacturing companies (Company X and Company Y). T...
Text Solution
|
- There are two car manufacturing companies (Company X and Company Y). T...
Text Solution
|
- There are two car manufacturing companies (Company X and Company Y). T...
Text Solution
|
- There are two car manufacturing companies (Company X and Company Y). T...
Text Solution
|
- There are two car manufacturing companies (Company X and Company Y). T...
Text Solution
|
- The given pie-chart shows the distribution (in degrees) of cars sold o...
Text Solution
|
- The given pie-chart shows the distribution (in degrees) of cars sold o...
Text Solution
|
- The given pie-chart shows the distribution (in degrees) of cars sold o...
Text Solution
|