A
B
C
D
Text Solution
Verified by Experts
The correct Answer is:


Similar Questions
Explore conceptually related problems
Recommended Questions
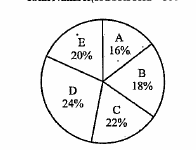
- Refer to the pie-chart and answer the given questions. Distribution ...
Text Solution
|
- The bar chart given below shows the sales (in '000 units) of 4 mobile ...
Text Solution
|
- The following graph shows the percentage increase in sales of branded ...
Text Solution
|
- The following graph shows the percentage increase in sales of branded ...
Text Solution
|
- The bar chart given below shows the sales (in '000 units) of 4 mobile ...
Text Solution
|
- The given bar graph shows the sale of different brands of shirts in a ...
Text Solution
|
- The bar graph showns the number of motorcycles of different brands sol...
Text Solution
|
- The bar graph shows the number of motorcycles of different brands sold...
Text Solution
|
- The bar graph shows the number of motorcycles of different brands sold...
Text Solution
|