A
B
C
D
Text Solution
Verified by Experts
The correct Answer is:


Similar Questions
Explore conceptually related problems
Recommended Questions
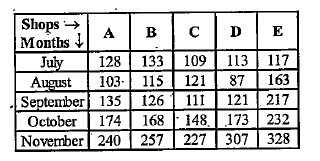
- Study the table and answer the given questions. The following data a...
Text Solution
|
- Calculate the mode of the following sizes of shoes sold by a shop on a...
Text Solution
|
- Given below is the number of pairs of shoes of different sizes sold in...
Text Solution
|
- एक दुकान में निम्नलिखित बंटन के अनुसार एक दिन में 100 जोड़े जूते बिके।...
Text Solution
|
- A shoe store sells pairs of shoes of different sizes. The number of pa...
Text Solution
|
- One shop sold 100 pairs of shoes a day according to the following dist...
Text Solution
|
- एक दुकान में निम्नलिखित बंटन के अनुसार एक दिन में 100 जोड़े जूते बिके...
Text Solution
|
- Shoes of the following brands were sold at a shoe store in November 20...
Text Solution
|
- Given below is the number of pairs of pairs of shoes of different size...
Text Solution
|