A
B
C
D
Text Solution
Verified by Experts
The correct Answer is:


Similar Questions
Explore conceptually related problems
Recommended Questions
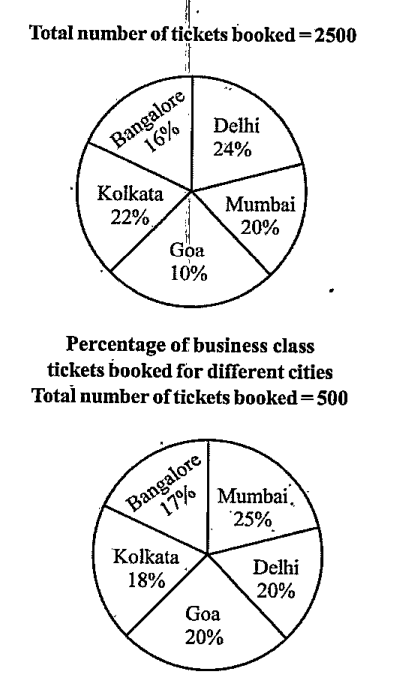
- Refer to the pie charts and answer the given questions. Data related...
Text Solution
|
- A book exhibition was held for four days in a school. The number of t...
Text Solution
|
- Match the following Column A to Column B
Text Solution
|
- The inequation represented by the graph given below is : <img src="htt...
Text Solution
|
- The inequation that best describes the graph given below is <img src=...
Text Solution
|
- he table shows the number of the ticket of 5 movies sold in 6 differen...
Text Solution
|
- हमने समय पर टिकट बुक करा लिया था ।
Text Solution
|
- The number of tickets of movie B sold in Hyderabad was approximately, ...
Text Solution
|
- The number of tickets of movie E sold in Chennai is what per cent of n...
Text Solution
|