A
B
C
D
Text Solution
Verified by Experts
The correct Answer is:


Similar Questions
Explore conceptually related problems
Recommended Questions
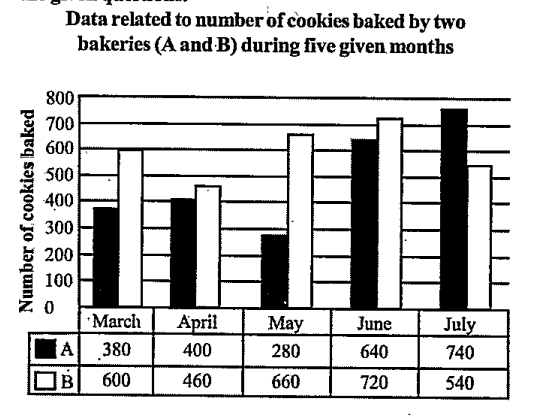
- Refer to the graph and answer the given questions Data related to nu...
Text Solution
|
- Rachita enters a shop to buy ice-creams, cookies and pastries. She ha...
Text Solution
|
- In a jar of cookies, there is (1)/(6) probability of randomly selectin...
Text Solution
|
- Mrs. Yang spends $3.00 a day on cookies for her family at a local sup...
Text Solution
|
- <>br> How many more cookies were sold by the 10th grade than were sold...
Text Solution
|
- If you sell the most cookies, you will win the prize.
Text Solution
|
- If you sell the most cookies, you will win the prize.
Text Solution
|
- If you sell the most cookies, you will win the prize.
Text Solution
|
- A shopkeeper sells an article for Rs 78 and earns double the profit th...
Text Solution
|