A
B
C
D
Text Solution
Verified by Experts
The correct Answer is:


Similar Questions
Explore conceptually related problems
Recommended Questions
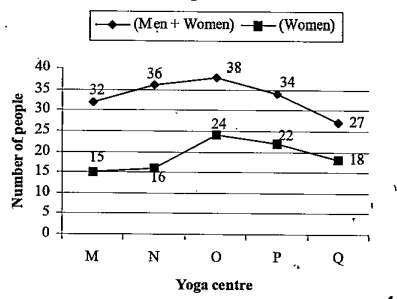
- Directions: The line graph shows the number of people(Men + Women) vis...
Text Solution
|
- निर्देश (252-256) : पांच विभिन्न संगठनों में पुरूषों और महिलाओं की सं...
Text Solution
|
- निर्देश (252-256) : पांच विभिन्न संगठनों में पुरूषों और महिलाओं की सं...
Text Solution
|
- निर्देश (252-256) : पांच विभिन्न संगठनों में पुरूषों और महिलाओं की सं...
Text Solution
|
- In the given figure (not to scale), O is the centre of the circle. A,B...
Text Solution
|
- Determine the point of symmetry of a regular hexagon. <img src="htt...
Text Solution
|
- In the given figure, AB is a diameter, O is the center of the circle ...
Text Solution
|
- Match the following Column A to Column B
Text Solution
|
- Match the following Column A to Column B
Text Solution
|