A
B
C
D
Text Solution
Verified by Experts
The correct Answer is:


Similar Questions
Explore conceptually related problems
Recommended Questions
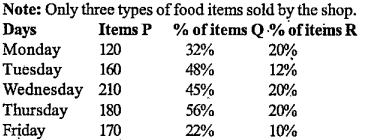
- Directions: Given below table shows total three types of food items (P...
Text Solution
|
- Match the items given in column A and B: ltimg src="https://d10lpgp6xz...
Text Solution
|
- If the quntity sold of item D increased by 50% and the price reduced b...
Text Solution
|
- Total value of the quanity sold for item C is what per cent of the to...
Text Solution
|
- If the price as well the quanity sold is increases by 20% for item A,...
Text Solution
|
- The average price per item in a shopping basket is $2.40. If there ar...
Text Solution
|
- A factory produces three items P,Q and R at two plants A and B . The n...
Text Solution
|
- WHAT TYPE OF ITEMS ARE SOLD IN THE MALLLS?
Text Solution
|
- WHAT TYPE OF ITEMS ARE SOLD IN THE MALLLS?
Text Solution
|