Home
Class 12
REASONING
Study the bar chart and answer the quest...

Study the bar chart and answer the question based on it.

The average production of 1996 and 1997 was exactly equal to the average production of which of the following pairs of years ?

A

1998 & 2000

B

1999 & 2000

C

1995 & 2001

D

2000 & 2001

Text Solution

Verified by Experts

Promotional Banner

Similar Questions

Explore conceptually related problems

Study the following graph and answer the questions given below it. The average production of 2004 and 2005 was exactly equal to the average production of which of the following pair of years?

Study the following graph and answer questions The average production of 2004 and 2005 was exactly equal to the average production of which of the following pairs of years?

Comprehension: Study the bar chart and answer the questions based on it. Production of Pesticides by Coromandal International Ltd. Company (in 1000 tonnes) The average production of 1996 and 1997 was exactly equal to the average production of which of the following pairs of years? A. 2000 and 2001 B. 1999 and 2000 C. 1998 and 2000 D. 1995 and 2001

Study the bar chart and answer the question based on it. In how many of the given years was the production of fertilizers less than the average production of the given years?

Study the given and answer the question that follows. Production of Fertilizers by a Company (in 10,000 tonnes) Over the Years The average production in 2000 and 2001 was less than the average production of which of the following pairs of years ?

Study the given and answer the question that follows. Production of Fertilizers by a Company (in 10,000 tonnes ) Over the Years The average production in 2000 and 2001 was less than the average production of which of the following paris of years ?

Study the given bar chart carefully and answer the questions based on it. Bar chart represents the production (in lakh tonne) of wheat from 2005 to 2010. For which of the following year, wheat production is maximum?

Study the given bar chart carefully and answer the questions based on it. Bar chart represents the production (in lakh tonne) of wheat from 2005 to 2010. For which of the following year, wheat production is minimum?

Study the following graph and answer the questions given below it. In how many of the given years was the production of salt more than the average production of the given years?

The following graph shows the production of wheat flour (in 1000 tonnes) by three companies X, Y and Z over the years. Study the graph and answer the questions. What is the ratio of the average production of company X in the period 2002-2004 to the average production of company Y in the same period ?

Recommended Questions
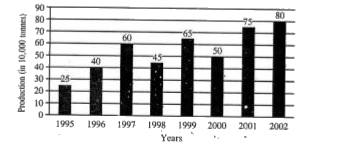
  1. Study the bar chart and answer the question based on it. The aver...

    Text Solution

    |

  2. 'वैलेस का चार्ट' पर टिप्पणी कीजिए!

    Text Solution

    |

  3. विकास का उत्प्रिवर्तनवाद निमिन्लिखित में से किसने प्रतिपादित किया था!

    Text Solution

    |

  4. चित्रानुसार एक दण्ड चुम्बक मुक्त रूप से एक कुण्डली के बीच से होकर गिरत...

    Text Solution

    |

  5. लेन्ज का नियम क्या है तथा यह किस राशि के संरक्षण पर आधारित है ?

    Text Solution

    |

  6. एक कुण्डली का क्षेत्रफल 100 सेमी^(2) है तथा उसमें 500 फेरे है | यदि कु...

    Text Solution

    |

  7. प्रत्यावर्ती परिपथ के लिए औसत शक्ति का व्यंजक प्राप्त कीजिए तथा...

    Text Solution

    |

  8. पाच वर्ष पूर्व, A की आयु B से तीन गुनी थी तथा दस वर्ष बाद A की आयु B स...

    Text Solution

    |

  9. समस्याओ में रेखिक समीकरणों के युग्म बनाइए और उनके हल (यदि उनका ...

    Text Solution

    |