Home
Class 12
REASONING
Comprehension: Study the bar chart and a...

Comprehension: Study the bar chart and answer the questions based on it.
Production of Pesticides by Coromandal International Ltd. Company (in 1000 tonnes)

In which year was the percentage increase in production as compared to the previous year the maximum?
A. 2002
B. 2001
C. 1997
D. 1996

A

2001

B

1996

C

1997

D

1999

Text Solution

Verified by Experts

Promotional Banner

Similar Questions

Explore conceptually related problems

Comprehension: Study the bar chart and answer the questions based on it. Production of Pesticides by Coromandal International Ltd. Company (in 1000 tonnes) What was the percentage increase in production of Pesticides in 2002 compared to that in 1995? A. 320% B. 300% C. 220% D. 200%

Comprehension: Study the bar chart and answer the questions based on it. Production of Pesticides by Coromandal International Ltd. Company (in 1000 tonnes) The average production of 1996 and 1997 was exactly equal to the average production of which of the following pairs of years? A. 2000 and 2001 B. 1999 and 2000 C. 1998 and 2000 D. 1995 and 2001

For Company A, in which year is the percentage increases/decrease in the production from the previous year the highest ?

Study the given bar chat and answer the question that follows. production of Fertilizers by a Company (in 10,000 tonnes) Over the Years What was the approximate percentage increase in the production of fertilizers from 1998 to 1999 ?

Read the following graph carefully and answer the questions given below. Production of sugar in three different factories over years (in thousand tonnes) In which year was the percentage increase/decrease in production of company B maximum ?

In which year was there maximum percentage increase in export of pearls to that in the previous year? (a) 2002 (b) 2007quad (c)2005 (d) 2004

Study the following bar graph and answer the question that follows. In which year was the maximum percentage increase in diamond exports compared to the previous year?

Read the following graph carefully and answer the questions given below. Production of sugar in three different factories over years (in thousand tonnes) What was the percentage decrease in production of company C in 2007 from previous year ?

In which year was the percentage of production of Company Z to the production of Company Y, the maximum? (a) 2006 (b) 2007 (c) 2008 (d) 2009( e) 2010

Study the following graph and answer questions What was the percentage increase in production of salt in 2008 compared to that of 2001?

Recommended Questions
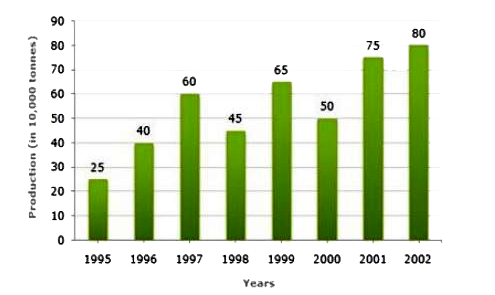
  1. Comprehension: Study the bar chart and answer the questions based on i...

    Text Solution

    |

  2. 1.5 वोल्ट का एक आदर्श सेल 100 Omega तथा 200 Omega के प्रतिरोधों क...

    Text Solution

    |

  3. संलग्न चित्र में प्रदर्शित परिपथ में व्हीटस्टोन सेतु में सन्धि B व D ...

    Text Solution

    |

  4. समस्याओ में रैखिक समीकरणो के युग्म बनाइए और अनके हल ( यदि उनक...

    Text Solution

    |

  5. किसी ऐसे वर्ष में जो लीप वर्ष न हो 53 रविवार होने की प्रायिकता क्या है...

    Text Solution

    |

  6. तीन तत्व A, B और C एक घनीय ठोस जलक में क्रिस्टलीकृत होते हैं । परमाणु ...

    Text Solution

    |

  7. एक धातु क्रिस्टलीकृत होकर एक जालक का निर्माण करती है जिसमे ABABAB........

    Text Solution

    |

  8. प्रयोग के आधार पर एक धातु ऑक्साइड का सूत्र M(0.98)O पाया गया । यदि धात...

    Text Solution

    |

  9. निम्नलिखित समीकरणों के अनुसार धातु A,B,C,D व H(2) की विधुत - रासायनिक ...

    Text Solution

    |