A
B
C
D
Text Solution
Verified by Experts


Similar Questions
Explore conceptually related problems
Recommended Questions
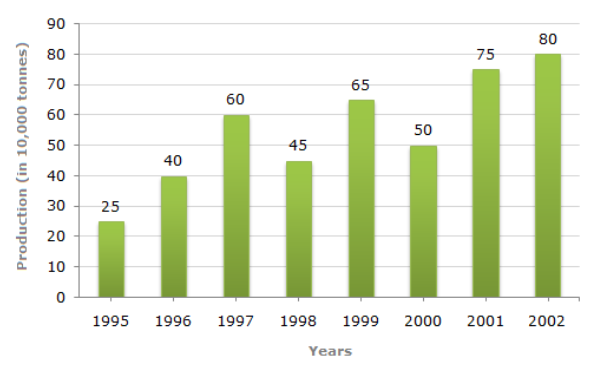
- Study the bar chart and answer the question based on it. In how many o...
Text Solution
|
- प्राकृतिक चयन सिद्धांत का प्रतिपादन किया था-
Text Solution
|
- दिए गए परिपथ में प्रत्येक शाखा में धारा का मान ज्ञात करे ? ।
Text Solution
|
- दिए गए परिपथ में धारा I का मान ज्ञात कीजिये ?
Text Solution
|
- दिए गये परिपथ में प्र्तेक सेल के सिरों के बीच विभवान्तर ज्ञात कीजिए ।
Text Solution
|
- दिए गये विघुत परिपथ में तथा के मध्य विभवान्तर की गणना कीजिए ।
Text Solution
|
- दिए गये विघुत परिपथ की सहायता से ज्ञात कीजिए - (i) परिपथ में धारा , ...
Text Solution
|
- चित्रानुसार एक दण्ड चुम्बक मुक्त रूप से एक कुण्डली के बीच से होकर गिरत...
Text Solution
|
- लेन्ज का नियम क्या है तथा यह किस राशि के संरक्षण पर आधारित है ?
Text Solution
|